29
/
en
AIzaSyAYiBZKx7MnpbEhh9jyipgxe19OcubqV5w
April 1, 2024
124968
Egypt, Arab Rep.
EGY
true
2
1
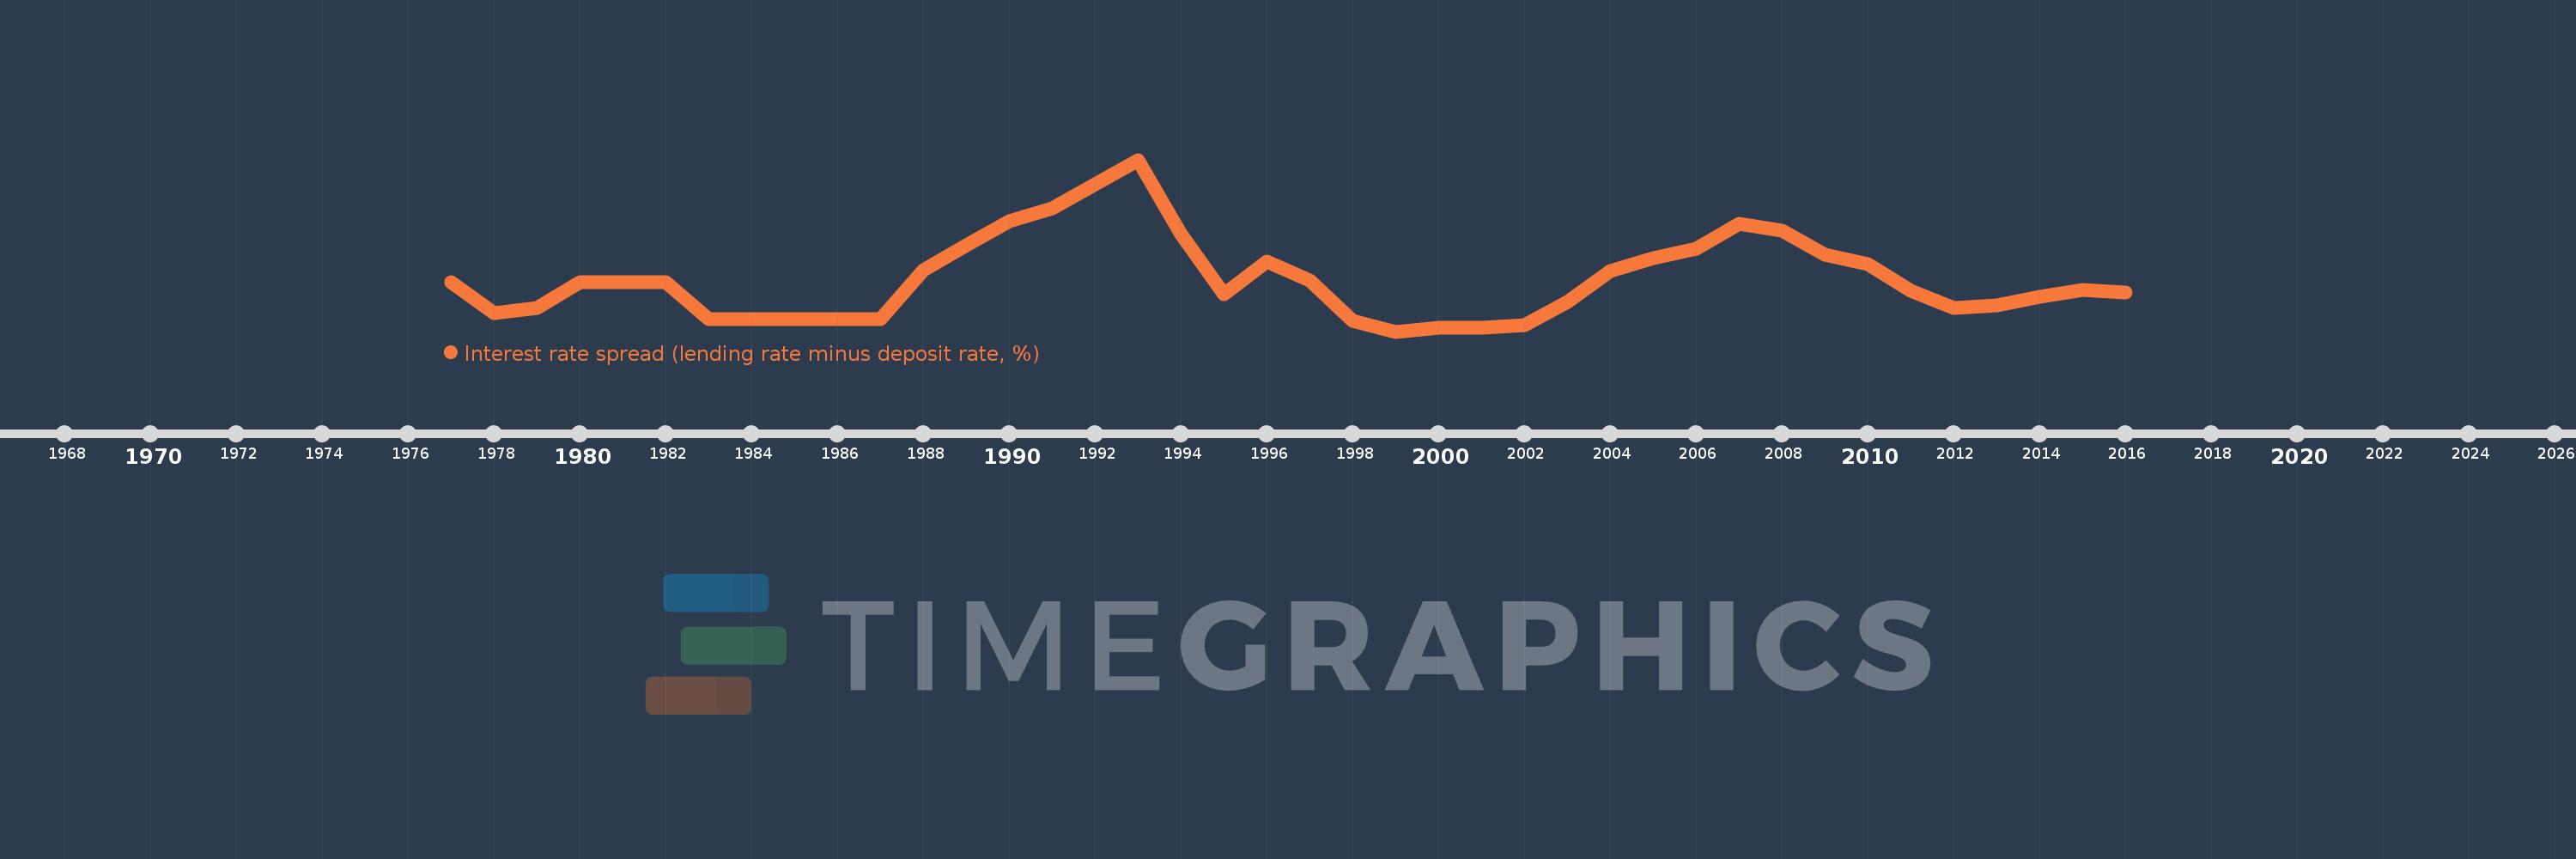
Interest rate spread (lending rate minus deposit rate, %)
2016,2015,2014,2013,2012,2011,2010,2009,2008,2007,2006,2005,2004,2003,2002,2001,2000,1999,1998,1997,1996,1995,1994,1993,1991,1990,1989,1988,1987,1986,1985,1984,1983,1982,1981,1980,1979,1978,1977
This statistics in other country:
AlbaniaAlgeriaAngolaAntigua and BarbudaArab WorldArgentinaArmeniaArubaAustraliaAustriaAzerbaijanBahamas, TheBahrainBangladeshBarbadosBelarusBelgiumBelizeBeninBhutanBoliviaBosnia and HerzegovinaBotswanaBrazilBrunei DarussalamBulgariaBurkina FasoBurundiCabo VerdeCameroonCanadaCaribbean small statesCentral African RepublicCentral Europe and the BalticsChadChileChinaColombiaComorosCongo, Dem. Rep.Congo, Rep.Costa RicaCote d'IvoireCroatiaCyprusCzech RepublicDenmarkDjiboutiDominicaDominican RepublicEarly-demographic dividendEast Asia & PacificEast Asia & Pacific (excluding high income)East Asia & Pacific (IDA & IBRD countries)EcuadorEgypt, Arab Rep.Equatorial GuineaEstoniaEthiopiaEuro areaEurope & Central AsiaEurope & Central Asia (excluding high income)Europe & Central Asia (IDA & IBRD countries)European UnionFijiFinlandFragile and conflict affected situationsFranceGabonGambia, TheGeorgiaGermanyGhanaGreeceGrenadaGuatemalaGuineaGuinea-BissauGuyanaHaitiHeavily indebted poor countries (HIPC)High incomeHondurasHong Kong SAR, ChinaHungaryIBRD onlyIcelandIDA & IBRD totalIDA blendIDA onlyIDA totalIndonesiaIran, Islamic Rep.IraqIrelandIsraelItalyJamaicaJapanJordanKenyaKorea, Rep.KosovoKuwaitKyrgyz RepublicLao PDRLate-demographic dividendLatin America & Caribbean Latin America & Caribbean (excluding high income)Latin America & the Caribbean (IDA & IBRD countries)LatviaLeast developed countries: UN classificationLebanonLesothoLiberiaLibyaLithuaniaLow & middle incomeLow incomeLower middle incomeLuxembourgMacao SAR, ChinaMacedonia, FYRMadagascarMalawiMalaysiaMaldivesMaliMaltaMauritaniaMauritiusMexicoMicronesia, Fed. Sts.Middle East & North AfricaMiddle East & North Africa (excluding high income)Middle East & North Africa (IDA & IBRD countries)Middle incomeMoldovaMongoliaMontenegroMoroccoMozambiqueMyanmarNamibiaNepalNetherlandsNew ZealandNicaraguaNigerNigeriaNorwayOECD membersOmanOther small statesPacific island small statesPanamaPapua New GuineaParaguayPeruPhilippinesPolandPortugalPost-demographic dividendPre-demographic dividendQatarRomaniaRussian FederationRwandaSamoaSan MarinoSao Tome and PrincipeSenegalSerbiaSeychellesSierra LeoneSingaporeSlovak RepublicSloveniaSmall statesSolomon IslandsSouth AfricaSouth AsiaSouth Asia (IDA & IBRD)South SudanSpainSri LankaSt. Kitts and NevisSt. LuciaSt. Vincent and the GrenadinesSub-Saharan Africa Sub-Saharan Africa (excluding high income)Sub-Saharan Africa (IDA & IBRD countries)SurinameSwazilandSwedenSwitzerlandSyrian Arab RepublicTajikistanTanzaniaThailandTimor-LesteTogoTongaTrinidad and TobagoTunisiaUgandaUkraineUnited KingdomUpper middle incomeUruguayVanuatuVenezuela, RBVietnamWest Bank and GazaWorldYemen, Rep.ZambiaZimbabwe Timeline:
This timeline shows a graph from 1977 to 2016 of Egypt, Arab Rep.. No data until 1976. Number of actual observations by date: 39.
Source name:
World Development Indicators
Source organization:
International Monetary Fund, International Financial Statistics and data files.
Categories, topics:
Financial Sector
Last updated:
apr 23, 2017
Indicators value changes by year
At the date of observation
Value
Absolute change
Change from previous value
jan 1, 1978
4.167
-0.833
-16.67%
jan 1, 1979
4.292
+0.125
3.0%
jan 1, 1980
5.0
+0.708
16.5%
jan 1, 1983
4.0
-1.0
-20.0%
jan 1, 1988
5.333
+1.333
33.33%
jan 1, 1989
6.0
+0.667
12.5%
jan 1, 1990
6.667
+0.667
11.11%
jan 1, 1991
7.0
+0.333
5.0%
jan 1, 1993
8.328
+1.328
18.98%
jan 1, 1994
6.298
-2.031
-24.38%
jan 1, 1995
4.679
-1.618
-25.7%
jan 1, 1996
5.554
+0.875
18.7%
jan 1, 1997
5.042
-0.512
-9.23%
jan 1, 1998
3.956
-1.085
-21.53%
jan 1, 1999
3.654
-0.302
-7.64%
jan 1, 2000
3.748
+0.093
2.55%
jan 1, 2001
3.759
+0.012
0.31%
jan 1, 2002
3.833
+0.074
1.97%
jan 1, 2003
4.458
+0.625
16.3%
jan 1, 2004
5.308
+0.85
19.07%
jan 1, 2005
5.65
+0.342
6.44%
jan 1, 2006
5.917
+0.267
4.72%
jan 1, 2007
6.583
+0.667
11.27%
jan 1, 2008
6.408
-0.175
-2.66%
jan 1, 2009
5.742
-0.667
-10.4%
jan 1, 2010
5.483
-0.258
-4.5%
jan 1, 2011
4.775
-0.708
-12.92%
jan 1, 2012
4.292
-0.483
-10.12%
jan 1, 2013
4.358
+0.067
1.55%
jan 1, 2014
4.608
+0.25
5.74%
jan 1, 2015
4.792
+0.183
3.98%
jan 1, 2016
4.717
-0.075
-1.57%
Ranking of countries by current statistics by years


Comments: