29
/
en
AIzaSyAYiBZKx7MnpbEhh9jyipgxe19OcubqV5w
April 1, 2024
43542
Latin America & the Caribbean (IDA & IBRD countries)
TLA
false
2
1
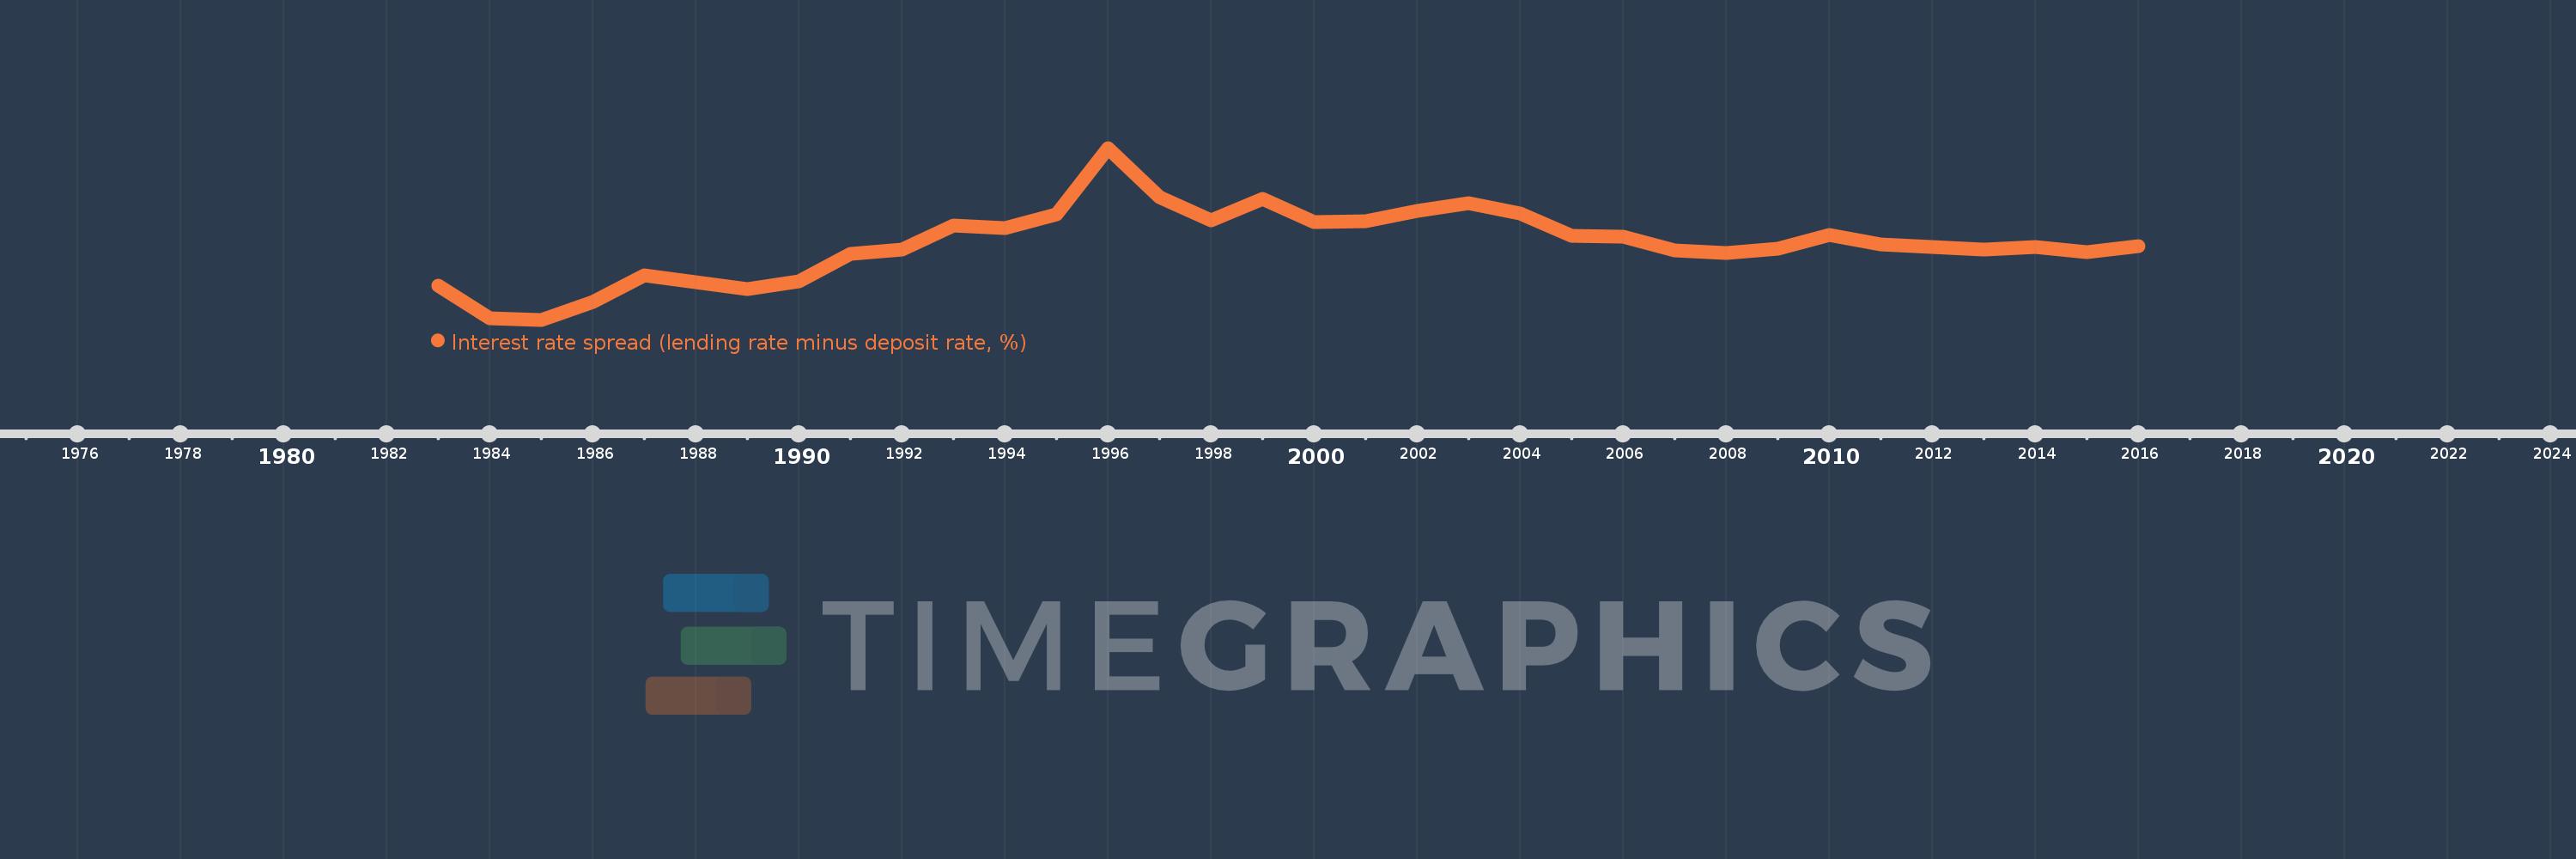
Interest rate spread (lending rate minus deposit rate, %)
2016,2015,2014,2013,2012,2011,2010,2009,2008,2007,2006,2005,2004,2003,2002,2001,2000,1999,1998,1997,1996,1995,1994,1993,1992,1991,1990,1989,1988,1987,1986,1985,1984,1983
This statistics in other country:
AlbaniaAlgeriaAngolaAntigua and BarbudaArab WorldArgentinaArmeniaArubaAustraliaAustriaAzerbaijanBahamas, TheBahrainBangladeshBarbadosBelarusBelgiumBelizeBeninBhutanBoliviaBosnia and HerzegovinaBotswanaBrazilBrunei DarussalamBulgariaBurkina FasoBurundiCabo VerdeCameroonCanadaCaribbean small statesCentral African RepublicCentral Europe and the BalticsChadChileChinaColombiaComorosCongo, Dem. Rep.Congo, Rep.Costa RicaCote d'IvoireCroatiaCyprusCzech RepublicDenmarkDjiboutiDominicaDominican RepublicEarly-demographic dividendEast Asia & PacificEast Asia & Pacific (excluding high income)East Asia & Pacific (IDA & IBRD countries)EcuadorEgypt, Arab Rep.Equatorial GuineaEstoniaEthiopiaEuro areaEurope & Central AsiaEurope & Central Asia (excluding high income)Europe & Central Asia (IDA & IBRD countries)European UnionFijiFinlandFragile and conflict affected situationsFranceGabonGambia, TheGeorgiaGermanyGhanaGreeceGrenadaGuatemalaGuineaGuinea-BissauGuyanaHaitiHeavily indebted poor countries (HIPC)High incomeHondurasHong Kong SAR, ChinaHungaryIBRD onlyIcelandIDA & IBRD totalIDA blendIDA onlyIDA totalIndonesiaIran, Islamic Rep.IraqIrelandIsraelItalyJamaicaJapanJordanKenyaKorea, Rep.KosovoKuwaitKyrgyz RepublicLao PDRLate-demographic dividendLatin America & Caribbean Latin America & Caribbean (excluding high income)Latin America & the Caribbean (IDA & IBRD countries)LatviaLeast developed countries: UN classificationLebanonLesothoLiberiaLibyaLithuaniaLow & middle incomeLow incomeLower middle incomeLuxembourgMacao SAR, ChinaMacedonia, FYRMadagascarMalawiMalaysiaMaldivesMaliMaltaMauritaniaMauritiusMexicoMicronesia, Fed. Sts.Middle East & North AfricaMiddle East & North Africa (excluding high income)Middle East & North Africa (IDA & IBRD countries)Middle incomeMoldovaMongoliaMontenegroMoroccoMozambiqueMyanmarNamibiaNepalNetherlandsNew ZealandNicaraguaNigerNigeriaNorwayOECD membersOmanOther small statesPacific island small statesPanamaPapua New GuineaParaguayPeruPhilippinesPolandPortugalPost-demographic dividendPre-demographic dividendQatarRomaniaRussian FederationRwandaSamoaSan MarinoSao Tome and PrincipeSenegalSerbiaSeychellesSierra LeoneSingaporeSlovak RepublicSloveniaSmall statesSolomon IslandsSouth AfricaSouth AsiaSouth Asia (IDA & IBRD)South SudanSpainSri LankaSt. Kitts and NevisSt. LuciaSt. Vincent and the GrenadinesSub-Saharan Africa Sub-Saharan Africa (excluding high income)Sub-Saharan Africa (IDA & IBRD countries)SurinameSwazilandSwedenSwitzerlandSyrian Arab RepublicTajikistanTanzaniaThailandTimor-LesteTogoTongaTrinidad and TobagoTunisiaUgandaUkraineUnited KingdomUpper middle incomeUruguayVanuatuVenezuela, RBVietnamWest Bank and GazaWorldYemen, Rep.ZambiaZimbabwe Timeline:
This timeline shows a graph from 1983 to 2016 of Latin America & the Caribbean (IDA & IBRD countries). No data until 1982. Number of actual observations by date: 34.
Source name:
World Development Indicators
Source organization:
International Monetary Fund, International Financial Statistics and data files.
Categories, topics:
Financial Sector
Last updated:
apr 23, 2017
Indicators value changes by year
Maximum:
12.363
jan 1, 1996
At the date of observation
Value
Absolute change
Change from previous value
jan 1, 1983
5.25
+5.25
0.0%
jan 1, 1984
3.56
-1.69
-32.2%
jan 1, 1985
3.5
-0.06
-1.67%
jan 1, 1986
4.417
+0.917
26.19%
jan 1, 1987
5.781
+1.365
30.9%
jan 1, 1988
5.442
-0.339
-5.87%
jan 1, 1989
5.071
-0.371
-6.82%
jan 1, 1990
5.479
+0.408
8.05%
jan 1, 1991
6.912
+1.433
26.16%
jan 1, 1992
7.128
+0.216
3.12%
jan 1, 1993
8.346
+1.218
17.08%
jan 1, 1994
8.232
-0.114
-1.36%
jan 1, 1995
8.959
+0.727
8.83%
jan 1, 1996
12.363
+3.404
37.99%
jan 1, 1997
9.822
-2.54
-20.55%
jan 1, 1998
8.611
-1.212
-12.34%
jan 1, 1999
9.717
+1.106
12.84%
jan 1, 2000
8.532
-1.185
-12.2%
jan 1, 2001
8.593
+0.062
0.72%
jan 1, 2002
9.101
+0.508
5.91%
jan 1, 2003
9.515
+0.414
4.55%
jan 1, 2004
8.986
-0.529
-5.56%
jan 1, 2005
7.842
-1.143
-12.72%
jan 1, 2006
7.772
-0.071
-0.9%
jan 1, 2007
7.056
-0.716
-9.21%
jan 1, 2008
6.94
-0.116
-1.64%
jan 1, 2009
7.163
+0.223
3.21%
jan 1, 2010
7.878
+0.715
9.98%
jan 1, 2011
7.394
-0.484
-6.14%
jan 1, 2012
7.248
-0.147
-1.98%
jan 1, 2013
7.113
-0.135
-1.86%
jan 1, 2014
7.24
+0.127
1.78%
jan 1, 2015
6.981
-0.259
-3.57%
jan 1, 2016
7.276
+0.295
4.23%
Ranking of countries by current statistics by years


Comments: