29
/
en
AIzaSyAYiBZKx7MnpbEhh9jyipgxe19OcubqV5w
April 1, 2024
250004
St. Kitts and Nevis
KNA
true
2
1
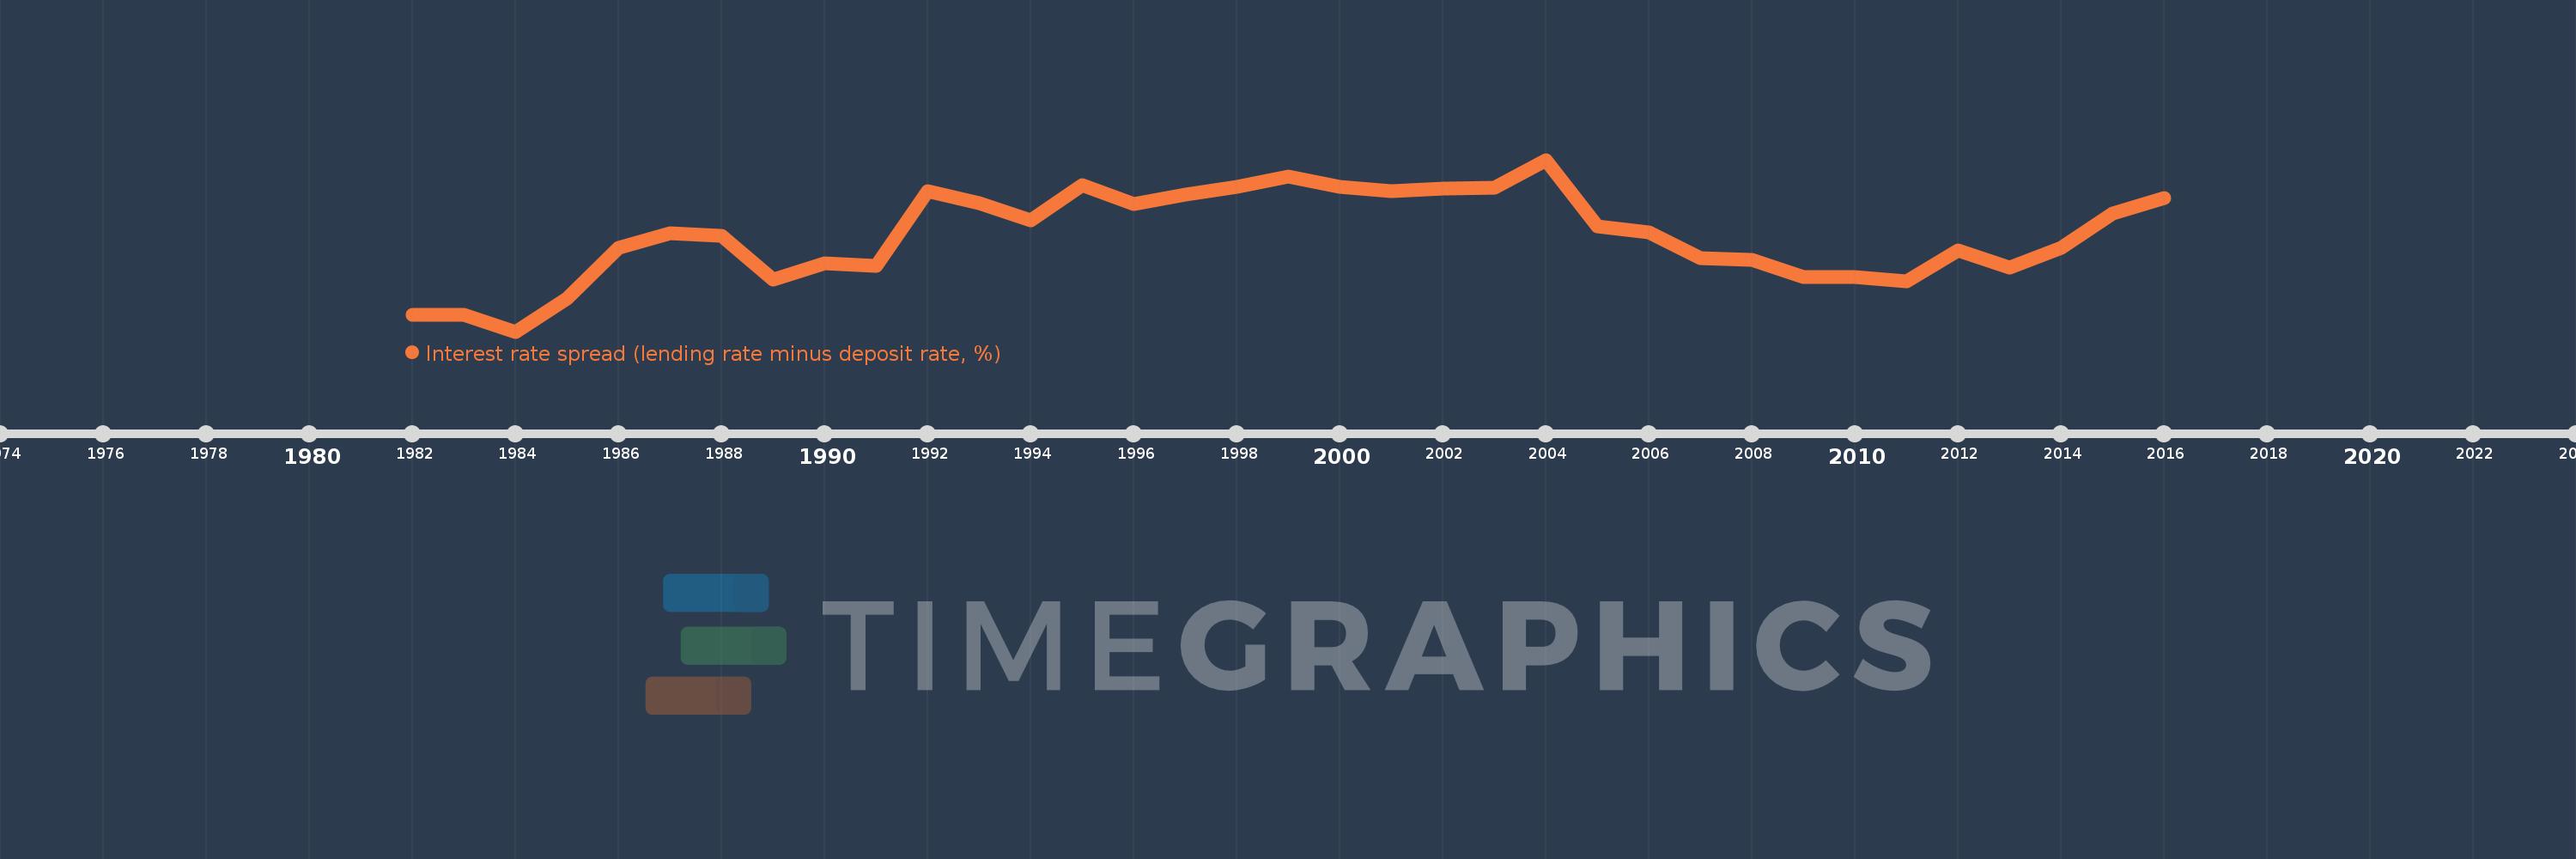
Interest rate spread (lending rate minus deposit rate, %)
2016,2015,2014,2013,2012,2011,2010,2009,2008,2007,2006,2005,2004,2003,2002,2001,2000,1999,1998,1997,1996,1995,1994,1993,1992,1991,1990,1989,1988,1987,1986,1985,1984,1983,1982
This statistics in other country:
AlbaniaAlgeriaAngolaAntigua and BarbudaArab WorldArgentinaArmeniaArubaAustraliaAustriaAzerbaijanBahamas, TheBahrainBangladeshBarbadosBelarusBelgiumBelizeBeninBhutanBoliviaBosnia and HerzegovinaBotswanaBrazilBrunei DarussalamBulgariaBurkina FasoBurundiCabo VerdeCameroonCanadaCaribbean small statesCentral African RepublicCentral Europe and the BalticsChadChileChinaColombiaComorosCongo, Dem. Rep.Congo, Rep.Costa RicaCote d'IvoireCroatiaCyprusCzech RepublicDenmarkDjiboutiDominicaDominican RepublicEarly-demographic dividendEast Asia & PacificEast Asia & Pacific (excluding high income)East Asia & Pacific (IDA & IBRD countries)EcuadorEgypt, Arab Rep.Equatorial GuineaEstoniaEthiopiaEuro areaEurope & Central AsiaEurope & Central Asia (excluding high income)Europe & Central Asia (IDA & IBRD countries)European UnionFijiFinlandFragile and conflict affected situationsFranceGabonGambia, TheGeorgiaGermanyGhanaGreeceGrenadaGuatemalaGuineaGuinea-BissauGuyanaHaitiHeavily indebted poor countries (HIPC)High incomeHondurasHong Kong SAR, ChinaHungaryIBRD onlyIcelandIDA & IBRD totalIDA blendIDA onlyIDA totalIndonesiaIran, Islamic Rep.IraqIrelandIsraelItalyJamaicaJapanJordanKenyaKorea, Rep.KosovoKuwaitKyrgyz RepublicLao PDRLate-demographic dividendLatin America & Caribbean Latin America & Caribbean (excluding high income)Latin America & the Caribbean (IDA & IBRD countries)LatviaLeast developed countries: UN classificationLebanonLesothoLiberiaLibyaLithuaniaLow & middle incomeLow incomeLower middle incomeLuxembourgMacao SAR, ChinaMacedonia, FYRMadagascarMalawiMalaysiaMaldivesMaliMaltaMauritaniaMauritiusMexicoMicronesia, Fed. Sts.Middle East & North AfricaMiddle East & North Africa (excluding high income)Middle East & North Africa (IDA & IBRD countries)Middle incomeMoldovaMongoliaMontenegroMoroccoMozambiqueMyanmarNamibiaNepalNetherlandsNew ZealandNicaraguaNigerNigeriaNorwayOECD membersOmanOther small statesPacific island small statesPanamaPapua New GuineaParaguayPeruPhilippinesPolandPortugalPost-demographic dividendPre-demographic dividendQatarRomaniaRussian FederationRwandaSamoaSan MarinoSao Tome and PrincipeSenegalSerbiaSeychellesSierra LeoneSingaporeSlovak RepublicSloveniaSmall statesSolomon IslandsSouth AfricaSouth AsiaSouth Asia (IDA & IBRD)South SudanSpainSri LankaSt. Kitts and NevisSt. LuciaSt. Vincent and the GrenadinesSub-Saharan Africa Sub-Saharan Africa (excluding high income)Sub-Saharan Africa (IDA & IBRD countries)SurinameSwazilandSwedenSwitzerlandSyrian Arab RepublicTajikistanTanzaniaThailandTimor-LesteTogoTongaTrinidad and TobagoTunisiaUgandaUkraineUnited KingdomUpper middle incomeUruguayVanuatuVenezuela, RBVietnamWest Bank and GazaWorldYemen, Rep.ZambiaZimbabwe Timeline:
This timeline shows a graph from 1982 to 2016 of St. Kitts and Nevis. No data until 1981. Number of actual observations by date: 35.
Source name:
World Development Indicators
Source organization:
International Monetary Fund, International Financial Statistics and data files.
Categories, topics:
Financial Sector
Last updated:
apr 23, 2017
Indicators value changes by year
At the date of observation
Value
Absolute change
Change from previous value
jan 1, 1984
2.5
-0.5
-16.67%
jan 1, 1985
3.5
+1.0
40.0%
jan 1, 1986
5.042
+1.542
44.05%
jan 1, 1987
5.5
+0.458
9.09%
jan 1, 1988
5.417
-0.083
-1.52%
jan 1, 1989
4.083
-1.333
-24.62%
jan 1, 1990
4.583
+0.5
12.24%
jan 1, 1991
4.5
-0.083
-1.82%
jan 1, 1992
6.774
+2.274
50.54%
jan 1, 1993
6.416
-0.358
-5.29%
jan 1, 1994
5.887
-0.529
-8.24%
jan 1, 1995
6.952
+1.065
18.09%
jan 1, 1996
6.37
-0.583
-8.38%
jan 1, 1997
6.659
+0.289
4.54%
jan 1, 1998
6.895
+0.237
3.55%
jan 1, 1999
7.204
+0.308
4.47%
jan 1, 2000
6.895
-0.309
-4.29%
jan 1, 2001
6.781
-0.113
-1.65%
jan 1, 2002
6.85
+0.068
1.01%
jan 1, 2003
6.882
+0.033
0.48%
jan 1, 2004
7.724
+0.841
12.22%
jan 1, 2005
5.709
-2.015
-26.09%
jan 1, 2006
5.525
-0.183
-3.21%
jan 1, 2007
4.74
-0.786
-14.22%
jan 1, 2008
4.682
-0.057
-1.21%
jan 1, 2009
4.153
-0.529
-11.31%
jan 1, 2010
4.162
+0.009
0.21%
jan 1, 2011
4.023
-0.138
-3.32%
jan 1, 2012
4.98
+0.956
23.77%
jan 1, 2013
4.459
-0.52
-10.45%
jan 1, 2014
5.04
+0.581
13.02%
jan 1, 2015
6.098
+1.058
20.99%
jan 1, 2016
6.574
+0.476
7.81%
Ranking of countries by current statistics by years


Comments: