29
/
en
AIzaSyAYiBZKx7MnpbEhh9jyipgxe19OcubqV5w
April 1, 2024
89981
Botswana
BWA
true
2
1
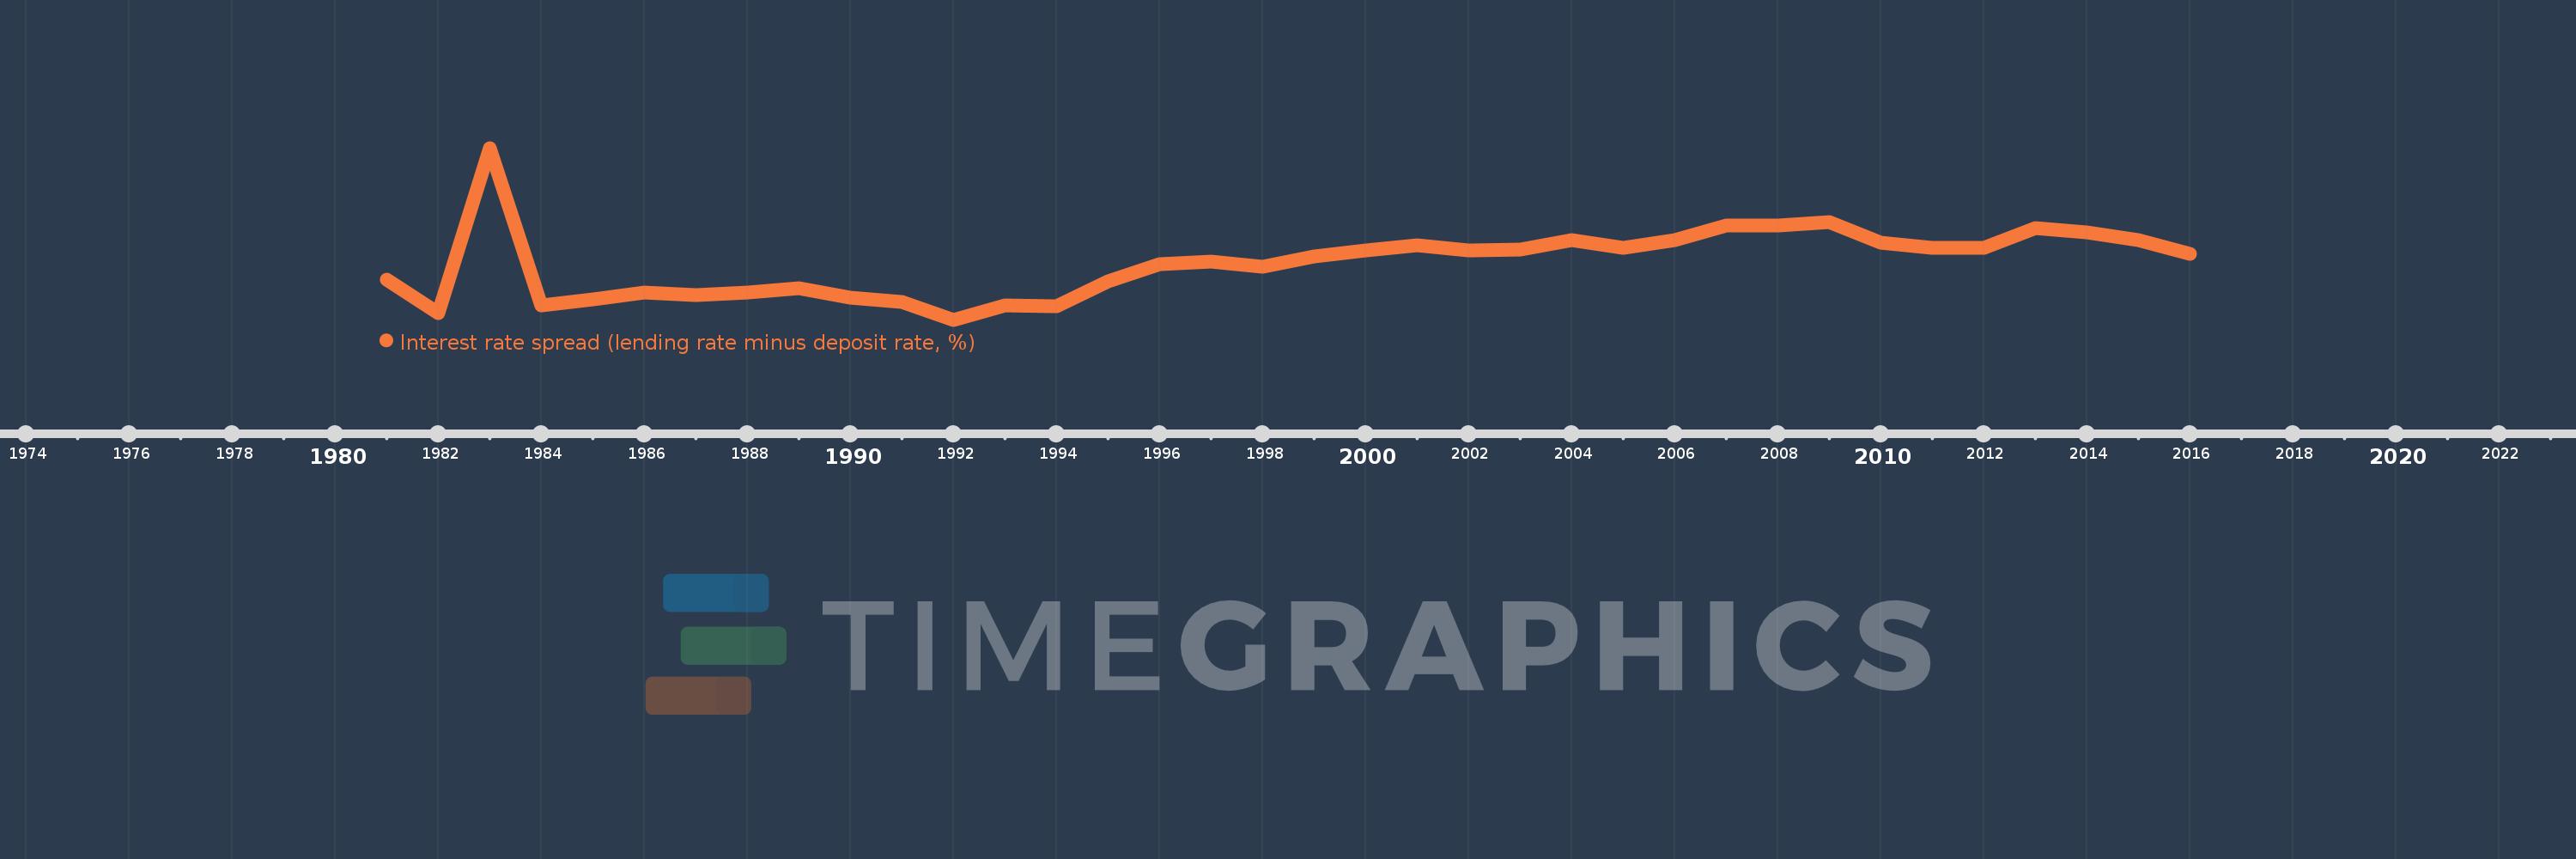
Interest rate spread (lending rate minus deposit rate, %)
2016,2015,2014,2013,2012,2011,2010,2009,2008,2007,2006,2005,2004,2003,2002,2001,2000,1999,1998,1997,1996,1995,1994,1993,1992,1991,1990,1989,1988,1987,1986,1985,1984,1983,1982,1981
This statistics in other country:
AlbaniaAlgeriaAngolaAntigua and BarbudaArab WorldArgentinaArmeniaArubaAustraliaAustriaAzerbaijanBahamas, TheBahrainBangladeshBarbadosBelarusBelgiumBelizeBeninBhutanBoliviaBosnia and HerzegovinaBotswanaBrazilBrunei DarussalamBulgariaBurkina FasoBurundiCabo VerdeCameroonCanadaCaribbean small statesCentral African RepublicCentral Europe and the BalticsChadChileChinaColombiaComorosCongo, Dem. Rep.Congo, Rep.Costa RicaCote d'IvoireCroatiaCyprusCzech RepublicDenmarkDjiboutiDominicaDominican RepublicEarly-demographic dividendEast Asia & PacificEast Asia & Pacific (excluding high income)East Asia & Pacific (IDA & IBRD countries)EcuadorEgypt, Arab Rep.Equatorial GuineaEstoniaEthiopiaEuro areaEurope & Central AsiaEurope & Central Asia (excluding high income)Europe & Central Asia (IDA & IBRD countries)European UnionFijiFinlandFragile and conflict affected situationsFranceGabonGambia, TheGeorgiaGermanyGhanaGreeceGrenadaGuatemalaGuineaGuinea-BissauGuyanaHaitiHeavily indebted poor countries (HIPC)High incomeHondurasHong Kong SAR, ChinaHungaryIBRD onlyIcelandIDA & IBRD totalIDA blendIDA onlyIDA totalIndonesiaIran, Islamic Rep.IraqIrelandIsraelItalyJamaicaJapanJordanKenyaKorea, Rep.KosovoKuwaitKyrgyz RepublicLao PDRLate-demographic dividendLatin America & Caribbean Latin America & Caribbean (excluding high income)Latin America & the Caribbean (IDA & IBRD countries)LatviaLeast developed countries: UN classificationLebanonLesothoLiberiaLibyaLithuaniaLow & middle incomeLow incomeLower middle incomeLuxembourgMacao SAR, ChinaMacedonia, FYRMadagascarMalawiMalaysiaMaldivesMaliMaltaMauritaniaMauritiusMexicoMicronesia, Fed. Sts.Middle East & North AfricaMiddle East & North Africa (excluding high income)Middle East & North Africa (IDA & IBRD countries)Middle incomeMoldovaMongoliaMontenegroMoroccoMozambiqueMyanmarNamibiaNepalNetherlandsNew ZealandNicaraguaNigerNigeriaNorwayOECD membersOmanOther small statesPacific island small statesPanamaPapua New GuineaParaguayPeruPhilippinesPolandPortugalPost-demographic dividendPre-demographic dividendQatarRomaniaRussian FederationRwandaSamoaSan MarinoSao Tome and PrincipeSenegalSerbiaSeychellesSierra LeoneSingaporeSlovak RepublicSloveniaSmall statesSolomon IslandsSouth AfricaSouth AsiaSouth Asia (IDA & IBRD)South SudanSpainSri LankaSt. Kitts and NevisSt. LuciaSt. Vincent and the GrenadinesSub-Saharan Africa Sub-Saharan Africa (excluding high income)Sub-Saharan Africa (IDA & IBRD countries)SurinameSwazilandSwedenSwitzerlandSyrian Arab RepublicTajikistanTanzaniaThailandTimor-LesteTogoTongaTrinidad and TobagoTunisiaUgandaUkraineUnited KingdomUpper middle incomeUruguayVanuatuVenezuela, RBVietnamWest Bank and GazaWorldYemen, Rep.ZambiaZimbabwe Timeline:
This timeline shows a graph from 1981 to 2016 of Botswana. No data until 1980. Number of actual observations by date: 36.
Source name:
World Development Indicators
Source organization:
International Monetary Fund, International Financial Statistics and data files.
Categories, topics:
Financial Sector
Last updated:
apr 23, 2017
Indicators value changes by year
Maximum:
13.458
jan 1, 1983
At the date of observation
Value
Absolute change
Change from previous value
jan 1, 1981
3.475
+3.475
0.0%
jan 1, 1982
0.958
-2.517
-72.42%
jan 1, 1983
13.458
+12.5
1.3K%
jan 1, 1984
1.5
-11.958
-88.85%
jan 1, 1985
2.0
+0.5
33.33%
jan 1, 1986
2.5
+0.5
25.0%
jan 1, 1987
2.333
-0.167
-6.67%
jan 1, 1988
2.5
+0.167
7.14%
jan 1, 1989
2.833
+0.333
13.33%
jan 1, 1990
2.083
-0.75
-26.47%
jan 1, 1991
1.76
-0.323
-15.5%
jan 1, 1992
0.433
-1.327
-75.38%
jan 1, 1993
1.5
+1.067
246.15%
jan 1, 1994
1.426
-0.074
-4.94%
jan 1, 1995
3.332
+1.906
133.66%
jan 1, 1996
4.632
+1.3
39.02%
jan 1, 1997
4.824
+0.192
4.16%
jan 1, 1998
4.432
-0.392
-8.12%
jan 1, 1999
5.219
+0.786
17.74%
jan 1, 2000
5.677
+0.458
8.78%
jan 1, 2001
6.063
+0.386
6.8%
jan 1, 2002
5.664
-0.399
-6.57%
jan 1, 2003
5.755
+0.09
1.6%
jan 1, 2004
6.455
+0.7
12.17%
jan 1, 2005
5.899
-0.556
-8.61%
jan 1, 2006
6.484
+0.585
9.91%
jan 1, 2007
7.587
+1.103
17.02%
jan 1, 2008
7.596
+0.009
0.12%
jan 1, 2009
7.868
+0.272
3.58%
jan 1, 2010
6.286
-1.582
-20.11%
jan 1, 2011
5.86
-0.426
-6.77%
jan 1, 2012
5.852
-0.008
-0.14%
jan 1, 2013
7.392
+1.54
26.32%
jan 1, 2014
7.08
-0.313
-4.23%
jan 1, 2015
6.466
-0.614
-8.67%
jan 1, 2016
5.448
-1.018
-15.74%
Ranking of countries by current statistics by years


Comments: