29
/
en
AIzaSyAYiBZKx7MnpbEhh9jyipgxe19OcubqV5w
April 1, 2024
56328
Small states
SST
false
2
1
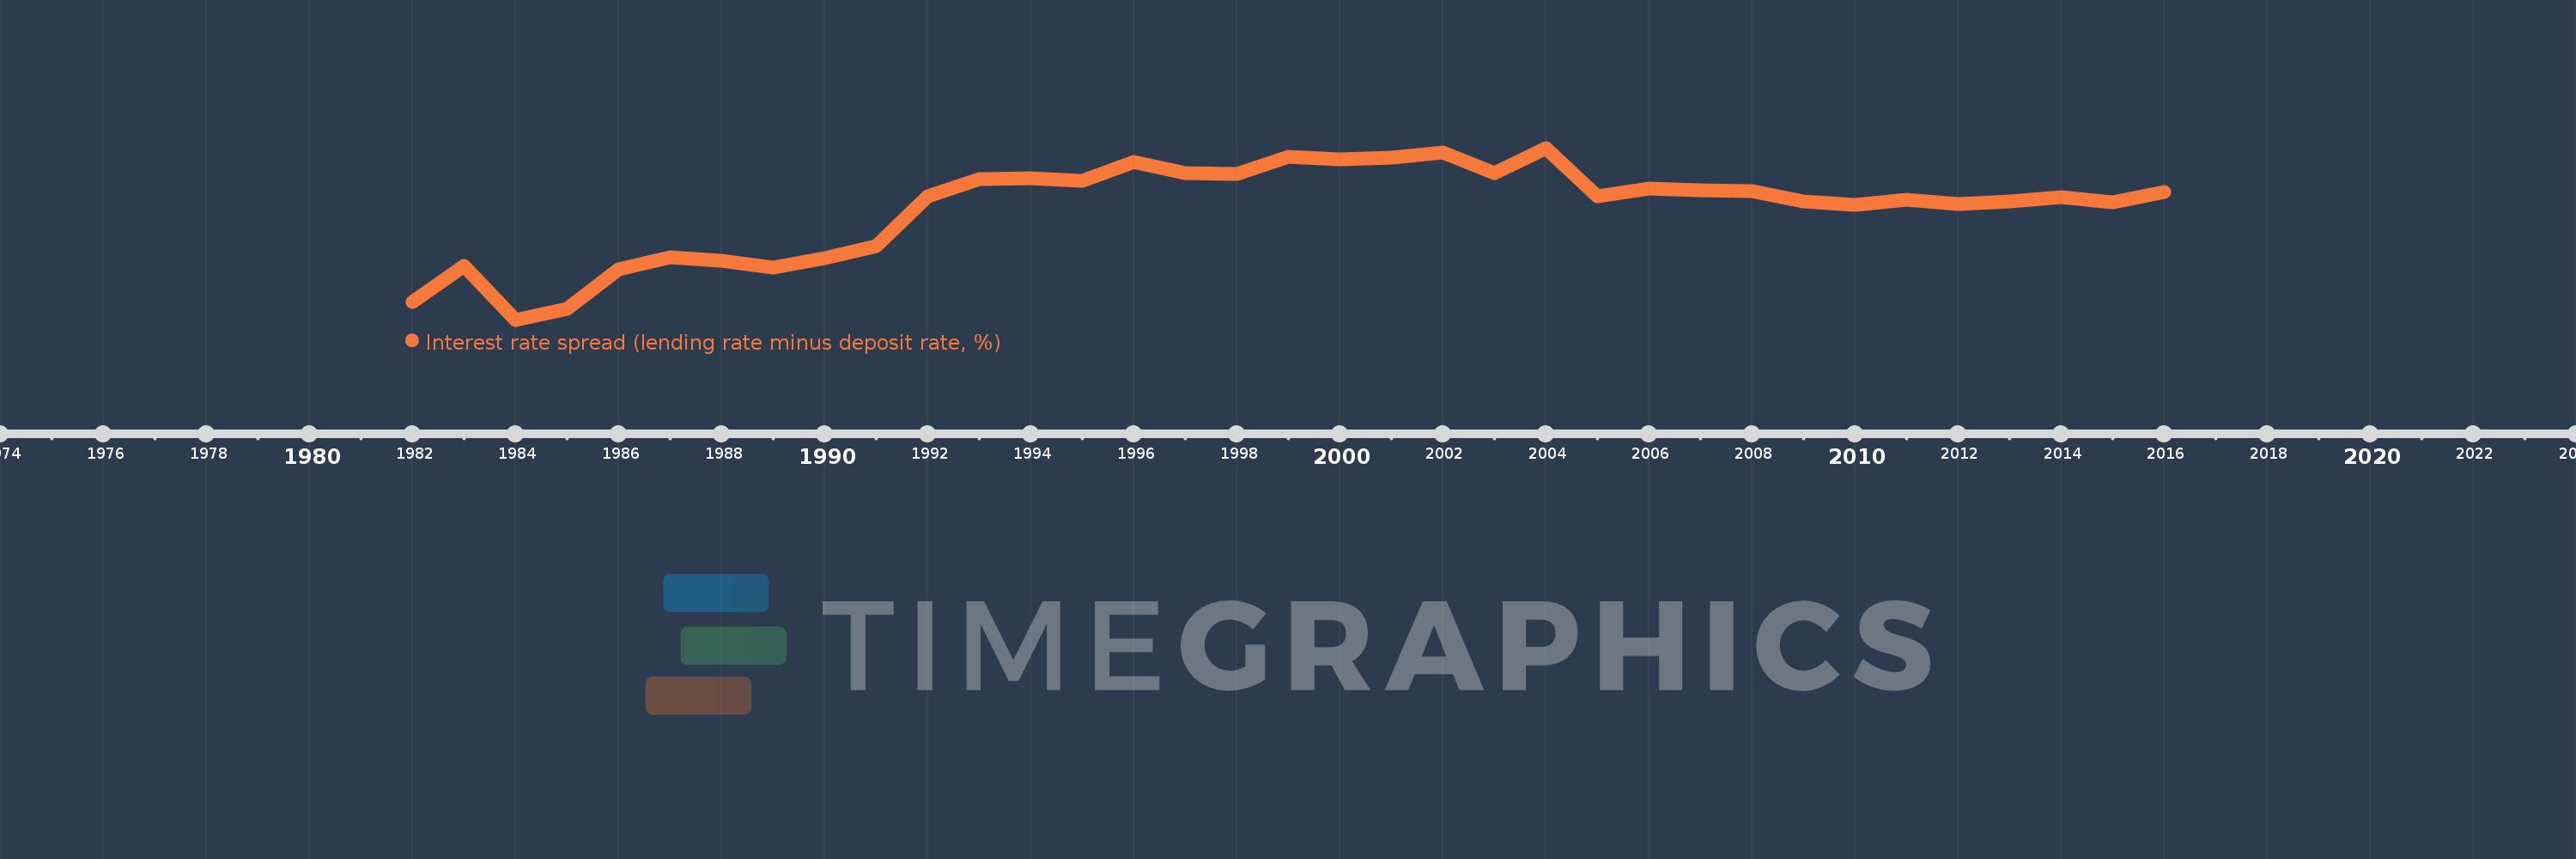
Interest rate spread (lending rate minus deposit rate, %)
2016,2015,2014,2013,2012,2011,2010,2009,2008,2007,2006,2005,2004,2003,2002,2001,2000,1999,1998,1997,1996,1995,1994,1993,1992,1991,1990,1989,1988,1987,1986,1985,1984,1983,1982
This statistics in other country:
AlbaniaAlgeriaAngolaAntigua and BarbudaArab WorldArgentinaArmeniaArubaAustraliaAustriaAzerbaijanBahamas, TheBahrainBangladeshBarbadosBelarusBelgiumBelizeBeninBhutanBoliviaBosnia and HerzegovinaBotswanaBrazilBrunei DarussalamBulgariaBurkina FasoBurundiCabo VerdeCameroonCanadaCaribbean small statesCentral African RepublicCentral Europe and the BalticsChadChileChinaColombiaComorosCongo, Dem. Rep.Congo, Rep.Costa RicaCote d'IvoireCroatiaCyprusCzech RepublicDenmarkDjiboutiDominicaDominican RepublicEarly-demographic dividendEast Asia & PacificEast Asia & Pacific (excluding high income)East Asia & Pacific (IDA & IBRD countries)EcuadorEgypt, Arab Rep.Equatorial GuineaEstoniaEthiopiaEuro areaEurope & Central AsiaEurope & Central Asia (excluding high income)Europe & Central Asia (IDA & IBRD countries)European UnionFijiFinlandFragile and conflict affected situationsFranceGabonGambia, TheGeorgiaGermanyGhanaGreeceGrenadaGuatemalaGuineaGuinea-BissauGuyanaHaitiHeavily indebted poor countries (HIPC)High incomeHondurasHong Kong SAR, ChinaHungaryIBRD onlyIcelandIDA & IBRD totalIDA blendIDA onlyIDA totalIndonesiaIran, Islamic Rep.IraqIrelandIsraelItalyJamaicaJapanJordanKenyaKorea, Rep.KosovoKuwaitKyrgyz RepublicLao PDRLate-demographic dividendLatin America & Caribbean Latin America & Caribbean (excluding high income)Latin America & the Caribbean (IDA & IBRD countries)LatviaLeast developed countries: UN classificationLebanonLesothoLiberiaLibyaLithuaniaLow & middle incomeLow incomeLower middle incomeLuxembourgMacao SAR, ChinaMacedonia, FYRMadagascarMalawiMalaysiaMaldivesMaliMaltaMauritaniaMauritiusMexicoMicronesia, Fed. Sts.Middle East & North AfricaMiddle East & North Africa (excluding high income)Middle East & North Africa (IDA & IBRD countries)Middle incomeMoldovaMongoliaMontenegroMoroccoMozambiqueMyanmarNamibiaNepalNetherlandsNew ZealandNicaraguaNigerNigeriaNorwayOECD membersOmanOther small statesPacific island small statesPanamaPapua New GuineaParaguayPeruPhilippinesPolandPortugalPost-demographic dividendPre-demographic dividendQatarRomaniaRussian FederationRwandaSamoaSan MarinoSao Tome and PrincipeSenegalSerbiaSeychellesSierra LeoneSingaporeSlovak RepublicSloveniaSmall statesSolomon IslandsSouth AfricaSouth AsiaSouth Asia (IDA & IBRD)South SudanSpainSri LankaSt. Kitts and NevisSt. LuciaSt. Vincent and the GrenadinesSub-Saharan Africa Sub-Saharan Africa (excluding high income)Sub-Saharan Africa (IDA & IBRD countries)SurinameSwazilandSwedenSwitzerlandSyrian Arab RepublicTajikistanTanzaniaThailandTimor-LesteTogoTongaTrinidad and TobagoTunisiaUgandaUkraineUnited KingdomUpper middle incomeUruguayVanuatuVenezuela, RBVietnamWest Bank and GazaWorldYemen, Rep.ZambiaZimbabwe Timeline:
This timeline shows a graph from 1982 to 2016 of Small states. No data until 1981. Number of actual observations by date: 35.
Source name:
World Development Indicators
Source organization:
International Monetary Fund, International Financial Statistics and data files.
Categories, topics:
Financial Sector
Last updated:
apr 23, 2017
Indicators value changes by year
At the date of observation
Value
Absolute change
Change from previous value
jan 1, 1982
4.067
+4.067
0.0%
jan 1, 1983
4.958
+0.892
21.93%
jan 1, 1984
3.641
-1.317
-26.56%
jan 1, 1985
3.917
+0.275
7.56%
jan 1, 1986
4.867
+0.95
24.26%
jan 1, 1987
5.167
+0.3
6.16%
jan 1, 1988
5.092
-0.075
-1.45%
jan 1, 1989
4.906
-0.185
-3.64%
jan 1, 1990
5.15
+0.244
4.97%
jan 1, 1991
5.438
+0.287
5.58%
jan 1, 1992
6.655
+1.217
22.38%
jan 1, 1993
7.084
+0.43
6.45%
jan 1, 1994
7.105
+0.021
0.29%
jan 1, 1995
7.034
-0.071
-1.0%
jan 1, 1996
7.5
+0.466
6.63%
jan 1, 1997
7.225
-0.275
-3.67%
jan 1, 1998
7.207
-0.018
-0.25%
jan 1, 1999
7.625
+0.418
5.8%
jan 1, 2000
7.558
-0.067
-0.89%
jan 1, 2001
7.599
+0.042
0.55%
jan 1, 2002
7.738
+0.138
1.82%
jan 1, 2003
7.221
-0.517
-6.68%
jan 1, 2004
7.842
+0.621
8.6%
jan 1, 2005
6.661
-1.181
-15.06%
jan 1, 2006
6.839
+0.178
2.67%
jan 1, 2007
6.809
-0.03
-0.44%
jan 1, 2008
6.792
-0.016
-0.24%
jan 1, 2009
6.538
-0.255
-3.75%
jan 1, 2010
6.445
-0.093
-1.42%
jan 1, 2011
6.577
+0.132
2.05%
jan 1, 2012
6.464
-0.113
-1.71%
jan 1, 2013
6.539
+0.074
1.15%
jan 1, 2014
6.63
+0.091
1.4%
jan 1, 2015
6.509
-0.121
-1.82%
jan 1, 2016
6.772
+0.263
4.04%
Ranking of countries by current statistics by years


Comments: