29
/
en
AIzaSyAYiBZKx7MnpbEhh9jyipgxe19OcubqV5w
April 1, 2024
266998
Trinidad and Tobago
TTO
true
2
1
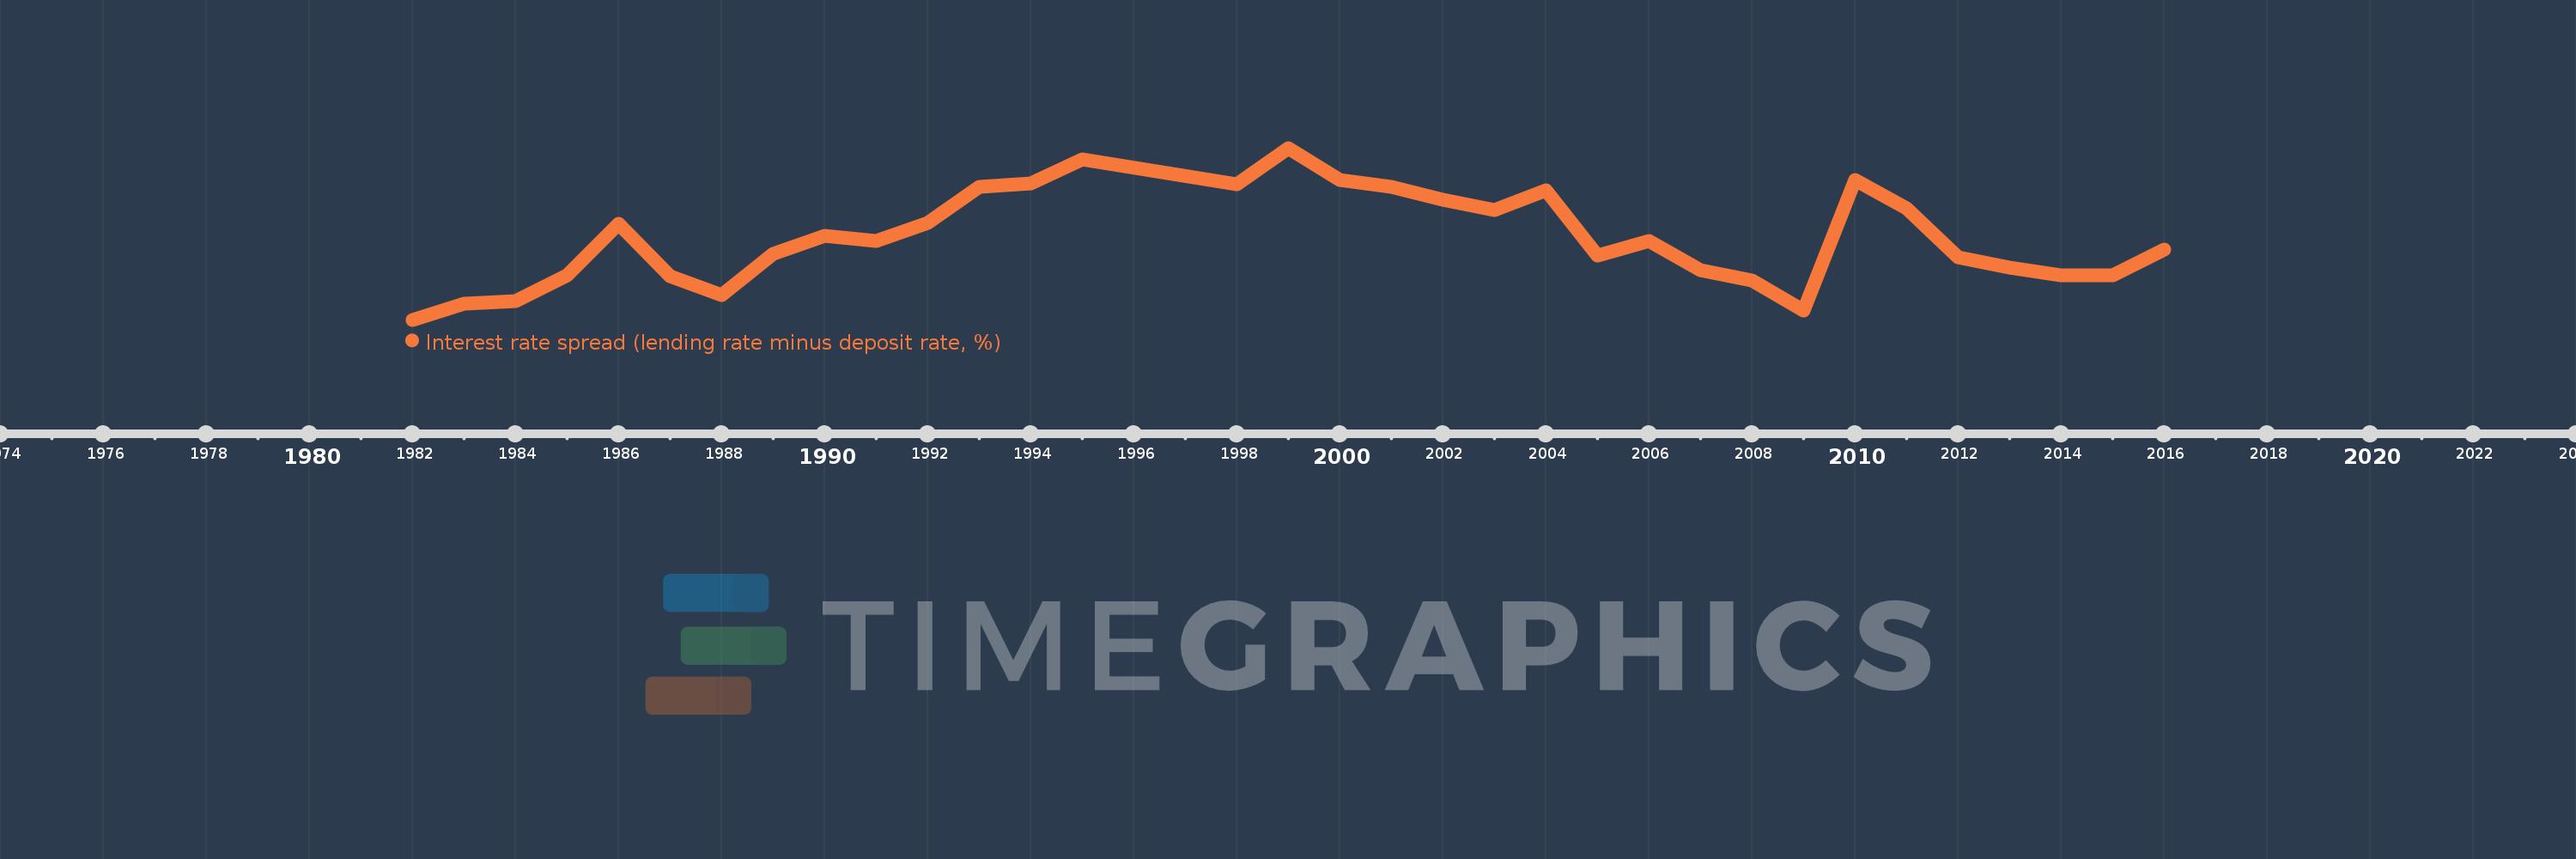
Interest rate spread (lending rate minus deposit rate, %)
2016,2015,2014,2013,2012,2011,2010,2009,2008,2007,2006,2005,2004,2003,2002,2001,2000,1999,1998,1995,1994,1993,1992,1991,1990,1989,1988,1987,1986,1985,1984,1983,1982
This statistics in other country:
AlbaniaAlgeriaAngolaAntigua and BarbudaArab WorldArgentinaArmeniaArubaAustraliaAustriaAzerbaijanBahamas, TheBahrainBangladeshBarbadosBelarusBelgiumBelizeBeninBhutanBoliviaBosnia and HerzegovinaBotswanaBrazilBrunei DarussalamBulgariaBurkina FasoBurundiCabo VerdeCameroonCanadaCaribbean small statesCentral African RepublicCentral Europe and the BalticsChadChileChinaColombiaComorosCongo, Dem. Rep.Congo, Rep.Costa RicaCote d'IvoireCroatiaCyprusCzech RepublicDenmarkDjiboutiDominicaDominican RepublicEarly-demographic dividendEast Asia & PacificEast Asia & Pacific (excluding high income)East Asia & Pacific (IDA & IBRD countries)EcuadorEgypt, Arab Rep.Equatorial GuineaEstoniaEthiopiaEuro areaEurope & Central AsiaEurope & Central Asia (excluding high income)Europe & Central Asia (IDA & IBRD countries)European UnionFijiFinlandFragile and conflict affected situationsFranceGabonGambia, TheGeorgiaGermanyGhanaGreeceGrenadaGuatemalaGuineaGuinea-BissauGuyanaHaitiHeavily indebted poor countries (HIPC)High incomeHondurasHong Kong SAR, ChinaHungaryIBRD onlyIcelandIDA & IBRD totalIDA blendIDA onlyIDA totalIndonesiaIran, Islamic Rep.IraqIrelandIsraelItalyJamaicaJapanJordanKenyaKorea, Rep.KosovoKuwaitKyrgyz RepublicLao PDRLate-demographic dividendLatin America & Caribbean Latin America & Caribbean (excluding high income)Latin America & the Caribbean (IDA & IBRD countries)LatviaLeast developed countries: UN classificationLebanonLesothoLiberiaLibyaLithuaniaLow & middle incomeLow incomeLower middle incomeLuxembourgMacao SAR, ChinaMacedonia, FYRMadagascarMalawiMalaysiaMaldivesMaliMaltaMauritaniaMauritiusMexicoMicronesia, Fed. Sts.Middle East & North AfricaMiddle East & North Africa (excluding high income)Middle East & North Africa (IDA & IBRD countries)Middle incomeMoldovaMongoliaMontenegroMoroccoMozambiqueMyanmarNamibiaNepalNetherlandsNew ZealandNicaraguaNigerNigeriaNorwayOECD membersOmanOther small statesPacific island small statesPanamaPapua New GuineaParaguayPeruPhilippinesPolandPortugalPost-demographic dividendPre-demographic dividendQatarRomaniaRussian FederationRwandaSamoaSan MarinoSao Tome and PrincipeSenegalSerbiaSeychellesSierra LeoneSingaporeSlovak RepublicSloveniaSmall statesSolomon IslandsSouth AfricaSouth AsiaSouth Asia (IDA & IBRD)South SudanSpainSri LankaSt. Kitts and NevisSt. LuciaSt. Vincent and the GrenadinesSub-Saharan Africa Sub-Saharan Africa (excluding high income)Sub-Saharan Africa (IDA & IBRD countries)SurinameSwazilandSwedenSwitzerlandSyrian Arab RepublicTajikistanTanzaniaThailandTimor-LesteTogoTongaTrinidad and TobagoTunisiaUgandaUkraineUnited KingdomUpper middle incomeUruguayVanuatuVenezuela, RBVietnamWest Bank and GazaWorldYemen, Rep.ZambiaZimbabwe Timeline:
This timeline shows a graph from 1982 to 2016 of Trinidad and Tobago. No data until 1981. Number of actual observations by date: 33.
Source name:
World Development Indicators
Source organization:
International Monetary Fund, International Financial Statistics and data files.
Categories, topics:
Financial Sector
Last updated:
apr 23, 2017
Indicators value changes by year
At the date of observation
Value
Absolute change
Change from previous value
jan 1, 1982
4.813
+4.813
0.0%
jan 1, 1983
5.25
+0.437
9.09%
jan 1, 1984
5.313
+0.063
1.21%
jan 1, 1985
5.993
+0.679
12.78%
jan 1, 1986
7.374
+1.382
23.06%
jan 1, 1987
5.963
-1.412
-19.14%
jan 1, 1988
5.468
-0.495
-8.3%
jan 1, 1989
6.573
+1.106
20.23%
jan 1, 1990
7.037
+0.463
7.05%
jan 1, 1991
6.912
-0.124
-1.76%
jan 1, 1992
7.378
+0.465
6.73%
jan 1, 1993
8.346
+0.968
13.13%
jan 1, 1994
8.438
+0.092
1.1%
jan 1, 1995
9.073
+0.636
7.54%
jan 1, 1998
8.424
-0.649
-7.15%
jan 1, 1999
9.38
+0.956
11.35%
jan 1, 2000
8.532
-0.848
-9.04%
jan 1, 2001
8.349
-0.183
-2.14%
jan 1, 2002
8.004
-0.345
-4.13%
jan 1, 2003
7.719
-0.285
-3.56%
jan 1, 2004
8.253
+0.533
6.91%
jan 1, 2005
6.521
-1.732
-20.98%
jan 1, 2006
6.907
+0.386
5.92%
jan 1, 2007
6.129
-0.778
-11.26%
jan 1, 2008
5.85
-0.279
-4.55%
jan 1, 2009
5.067
-0.782
-13.38%
jan 1, 2010
8.519
+3.452
68.11%
jan 1, 2011
7.777
-0.742
-8.71%
jan 1, 2012
6.469
-1.308
-16.82%
jan 1, 2013
6.208
-0.261
-4.03%
jan 1, 2014
6.0
-0.208
-3.36%
jan 1, 2016
6.683
+0.683
11.38%
Ranking of countries by current statistics by years


Comments: