29
/
en
AIzaSyAYiBZKx7MnpbEhh9jyipgxe19OcubqV5w
April 1, 2024
26624
Early-demographic dividend
EAR
false
2
1
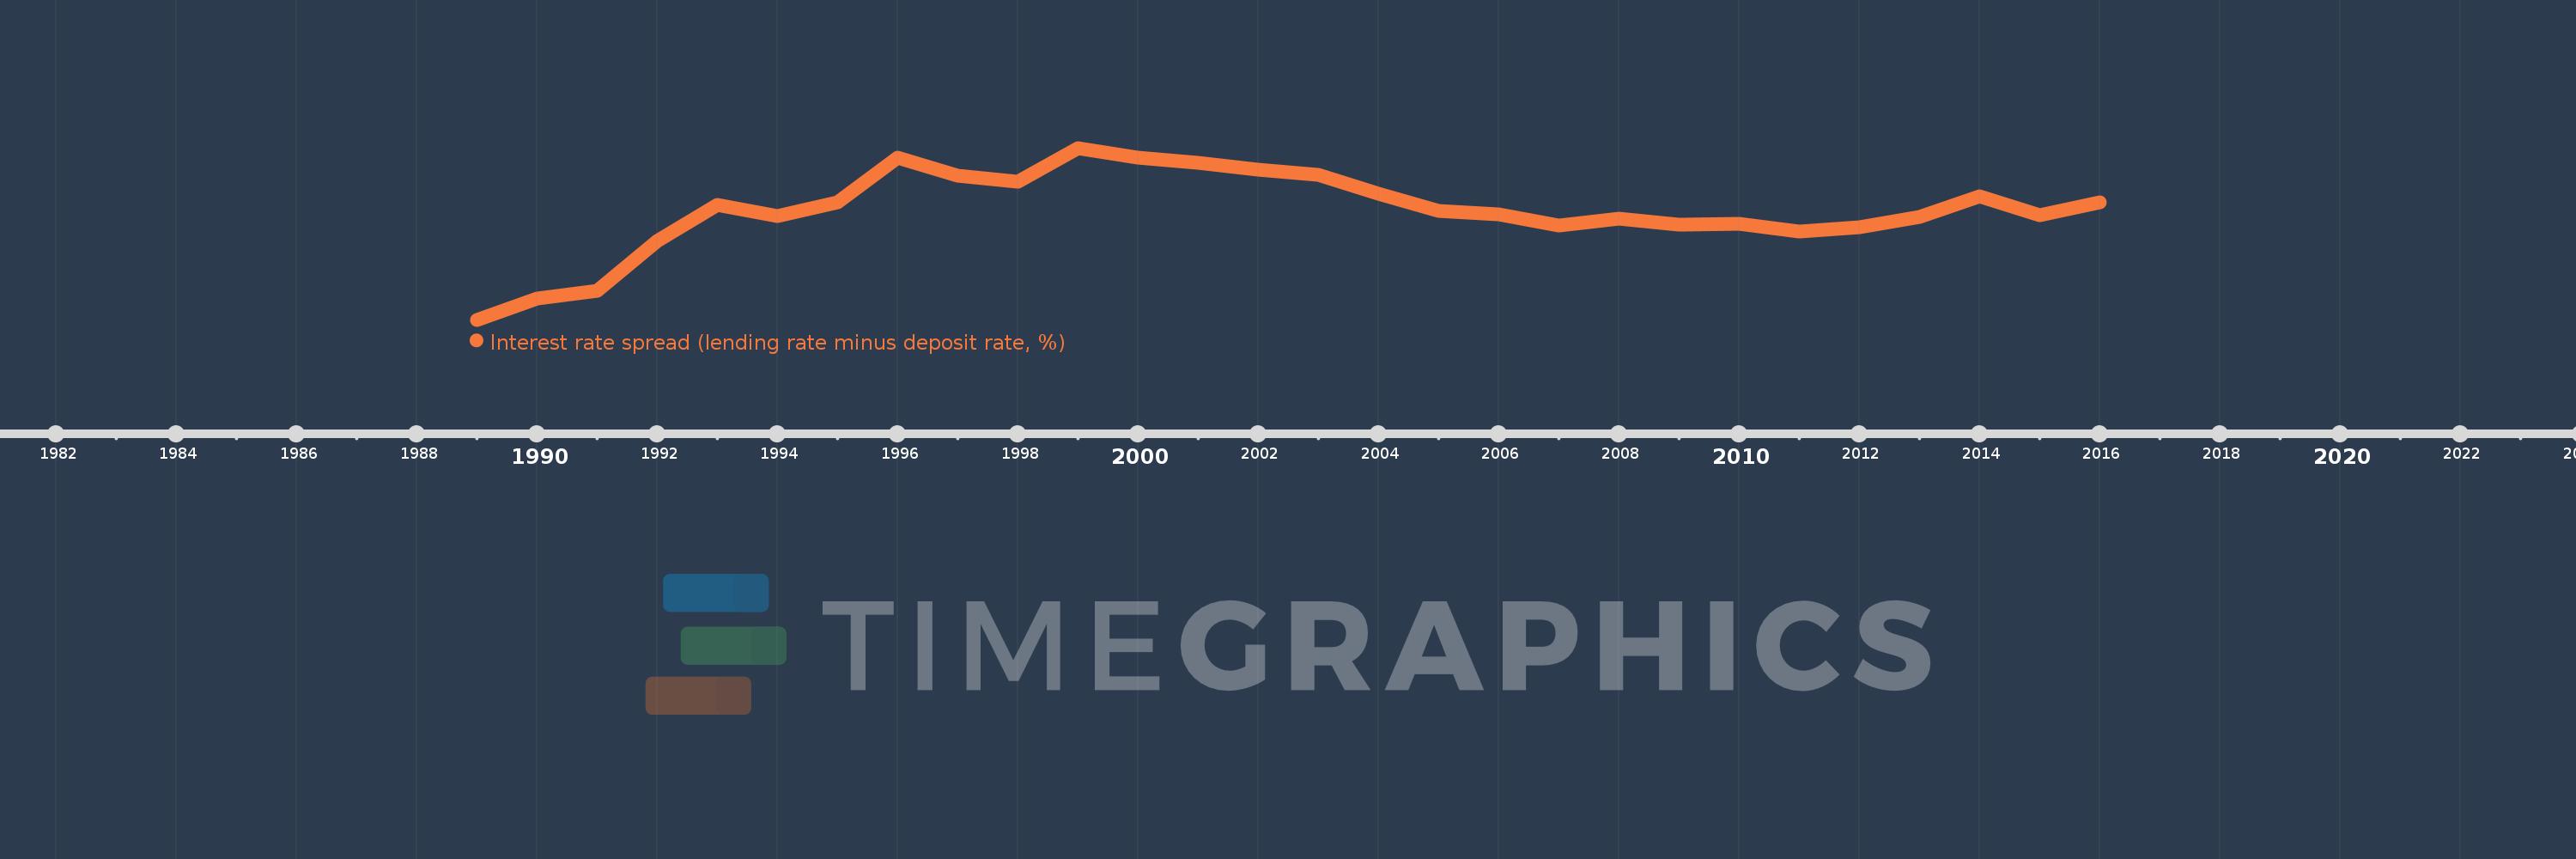
Interest rate spread (lending rate minus deposit rate, %)
2016,2015,2014,2013,2012,2011,2010,2009,2008,2007,2006,2005,2004,2003,2002,2001,2000,1999,1998,1997,1996,1995,1994,1993,1992,1991,1990,1989
This statistics in other country:
AlbaniaAlgeriaAngolaAntigua and BarbudaArab WorldArgentinaArmeniaArubaAustraliaAustriaAzerbaijanBahamas, TheBahrainBangladeshBarbadosBelarusBelgiumBelizeBeninBhutanBoliviaBosnia and HerzegovinaBotswanaBrazilBrunei DarussalamBulgariaBurkina FasoBurundiCabo VerdeCameroonCanadaCaribbean small statesCentral African RepublicCentral Europe and the BalticsChadChileChinaColombiaComorosCongo, Dem. Rep.Congo, Rep.Costa RicaCote d'IvoireCroatiaCyprusCzech RepublicDenmarkDjiboutiDominicaDominican RepublicEarly-demographic dividendEast Asia & PacificEast Asia & Pacific (excluding high income)East Asia & Pacific (IDA & IBRD countries)EcuadorEgypt, Arab Rep.Equatorial GuineaEstoniaEthiopiaEuro areaEurope & Central AsiaEurope & Central Asia (excluding high income)Europe & Central Asia (IDA & IBRD countries)European UnionFijiFinlandFragile and conflict affected situationsFranceGabonGambia, TheGeorgiaGermanyGhanaGreeceGrenadaGuatemalaGuineaGuinea-BissauGuyanaHaitiHeavily indebted poor countries (HIPC)High incomeHondurasHong Kong SAR, ChinaHungaryIBRD onlyIcelandIDA & IBRD totalIDA blendIDA onlyIDA totalIndonesiaIran, Islamic Rep.IraqIrelandIsraelItalyJamaicaJapanJordanKenyaKorea, Rep.KosovoKuwaitKyrgyz RepublicLao PDRLate-demographic dividendLatin America & Caribbean Latin America & Caribbean (excluding high income)Latin America & the Caribbean (IDA & IBRD countries)LatviaLeast developed countries: UN classificationLebanonLesothoLiberiaLibyaLithuaniaLow & middle incomeLow incomeLower middle incomeLuxembourgMacao SAR, ChinaMacedonia, FYRMadagascarMalawiMalaysiaMaldivesMaliMaltaMauritaniaMauritiusMexicoMicronesia, Fed. Sts.Middle East & North AfricaMiddle East & North Africa (excluding high income)Middle East & North Africa (IDA & IBRD countries)Middle incomeMoldovaMongoliaMontenegroMoroccoMozambiqueMyanmarNamibiaNepalNetherlandsNew ZealandNicaraguaNigerNigeriaNorwayOECD membersOmanOther small statesPacific island small statesPanamaPapua New GuineaParaguayPeruPhilippinesPolandPortugalPost-demographic dividendPre-demographic dividendQatarRomaniaRussian FederationRwandaSamoaSan MarinoSao Tome and PrincipeSenegalSerbiaSeychellesSierra LeoneSingaporeSlovak RepublicSloveniaSmall statesSolomon IslandsSouth AfricaSouth AsiaSouth Asia (IDA & IBRD)South SudanSpainSri LankaSt. Kitts and NevisSt. LuciaSt. Vincent and the GrenadinesSub-Saharan Africa Sub-Saharan Africa (excluding high income)Sub-Saharan Africa (IDA & IBRD countries)SurinameSwazilandSwedenSwitzerlandSyrian Arab RepublicTajikistanTanzaniaThailandTimor-LesteTogoTongaTrinidad and TobagoTunisiaUgandaUkraineUnited KingdomUpper middle incomeUruguayVanuatuVenezuela, RBVietnamWest Bank and GazaWorldYemen, Rep.ZambiaZimbabwe Timeline:
This timeline shows a graph from 1989 to 2016 of Early-demographic dividend. No data until 1988. Number of actual observations by date: 28.
Source name:
World Development Indicators
Source organization:
International Monetary Fund, International Financial Statistics and data files.
Categories, topics:
Financial Sector
Last updated:
apr 23, 2017
Indicators value changes by year
At the date of observation
Value
Absolute change
Change from previous value
jan 1, 1989
4.511
+4.511
0.0%
jan 1, 1990
4.917
+0.405
8.99%
jan 1, 1991
5.058
+0.142
2.88%
jan 1, 1992
6.0
+0.942
18.62%
jan 1, 1993
6.68
+0.68
11.33%
jan 1, 1994
6.456
-0.224
-3.36%
jan 1, 1995
6.715
+0.259
4.01%
jan 1, 1996
7.558
+0.843
12.55%
jan 1, 1997
7.225
-0.333
-4.4%
jan 1, 1998
7.106
-0.119
-1.65%
jan 1, 1999
7.747
+0.641
9.02%
jan 1, 2000
7.558
-0.19
-2.45%
jan 1, 2001
7.47
-0.088
-1.16%
jan 1, 2002
7.336
-0.134
-1.79%
jan 1, 2003
7.233
-0.103
-1.4%
jan 1, 2004
6.889
-0.344
-4.76%
jan 1, 2005
6.556
-0.333
-4.84%
jan 1, 2006
6.492
-0.064
-0.98%
jan 1, 2007
6.281
-0.211
-3.24%
jan 1, 2008
6.408
+0.127
2.02%
jan 1, 2009
6.3
-0.108
-1.69%
jan 1, 2010
6.323
+0.023
0.36%
jan 1, 2011
6.179
-0.144
-2.28%
jan 1, 2012
6.25
+0.071
1.15%
jan 1, 2013
6.45
+0.2
3.2%
jan 1, 2014
6.833
+0.383
5.94%
jan 1, 2015
6.475
-0.358
-5.24%
jan 1, 2016
6.716
+0.24
3.71%
Ranking of countries by current statistics by years


Comments: