29
/
en
AIzaSyAYiBZKx7MnpbEhh9jyipgxe19OcubqV5w
April 1, 2024
56738
South Asia
SAS
false
2
1
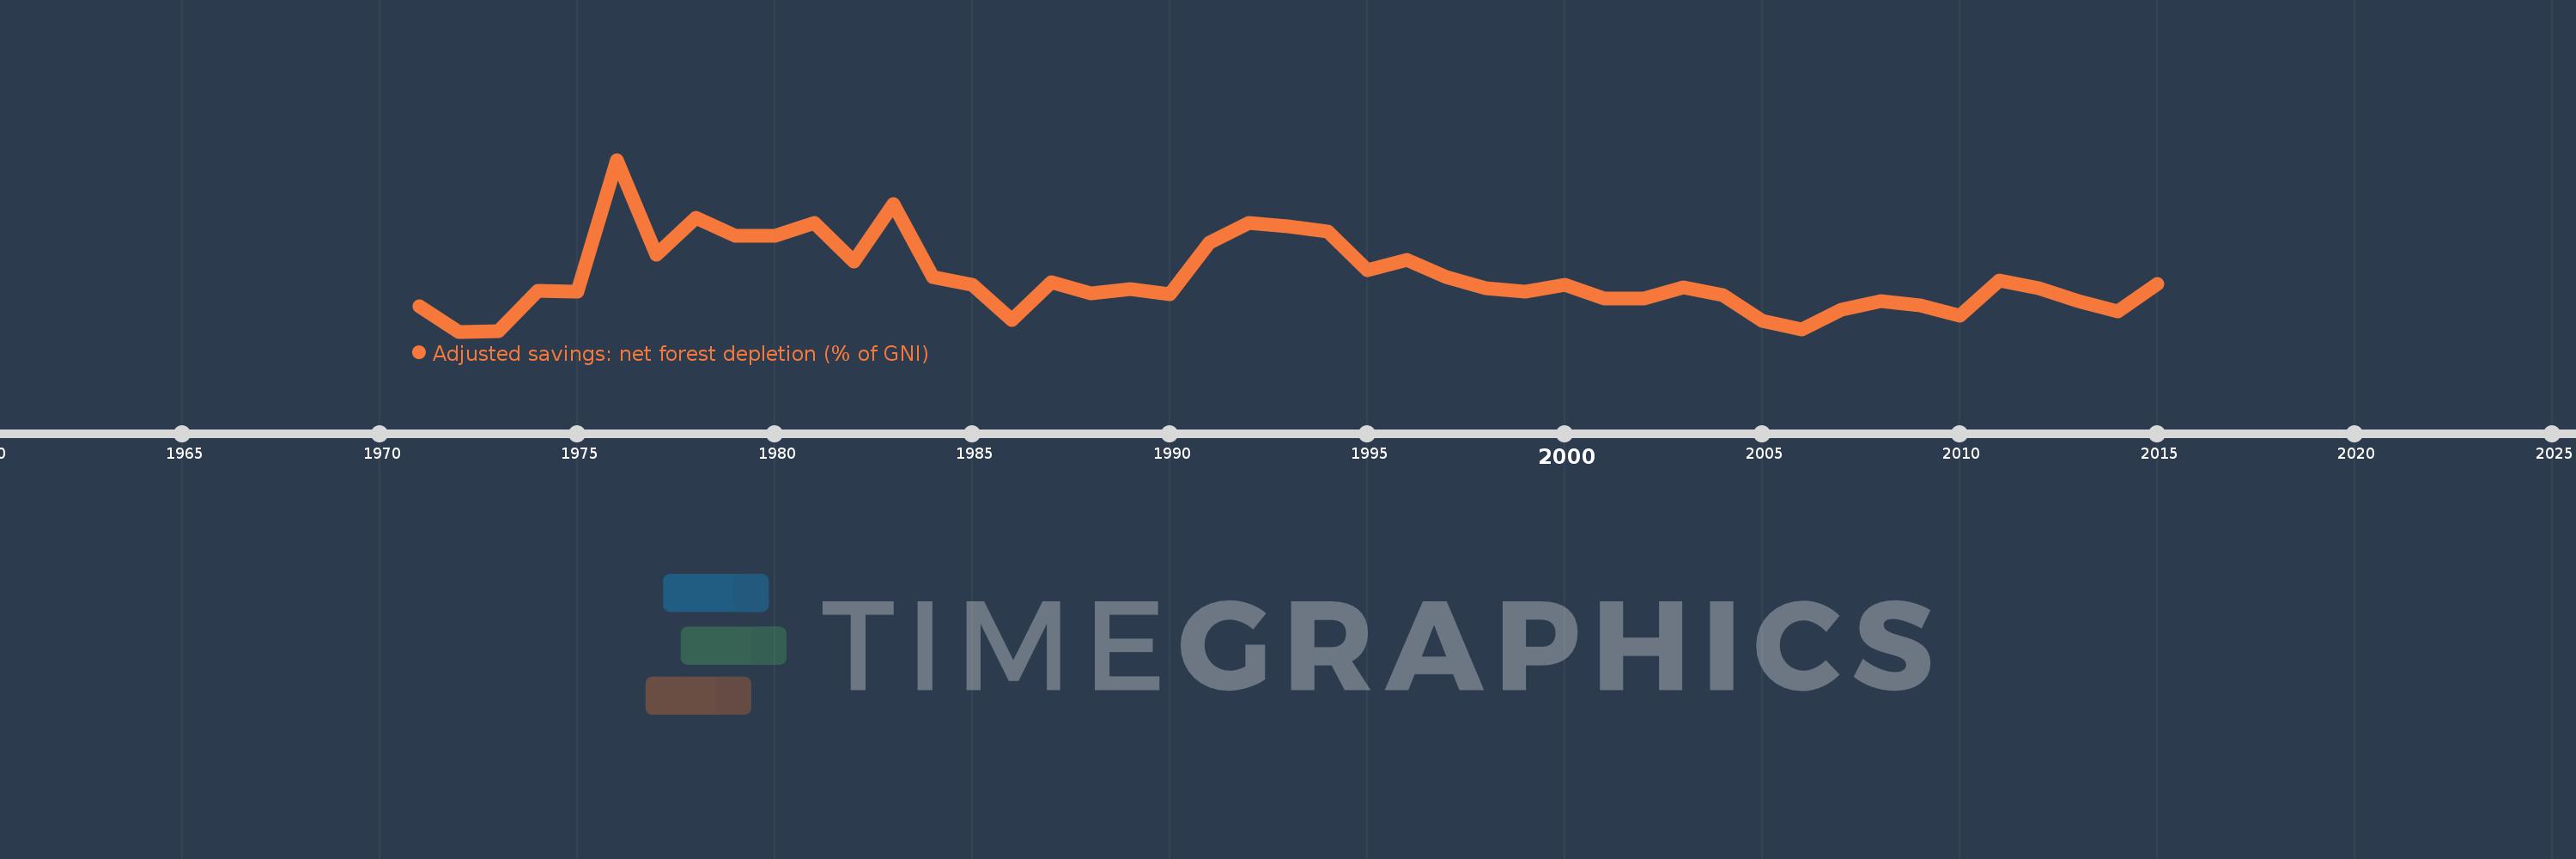
Adjusted savings: net forest depletion (% of GNI)
2015,2014,2013,2012,2011,2010,2009,2008,2007,2006,2005,2004,2003,2002,2001,2000,1999,1998,1997,1996,1995,1994,1993,1992,1991,1990,1989,1988,1987,1986,1985,1984,1983,1982,1981,1980,1979,1978,1977,1976,1975,1974,1973,1972,1971
This statistics in other country:
AfghanistanAlbaniaAlgeriaAngolaArab WorldArgentinaArmeniaAustraliaAustriaAzerbaijanBahamas, TheBahrainBangladeshBarbadosBelarusBelgiumBelizeBeninBhutanBoliviaBotswanaBrazilBrunei DarussalamBulgariaBurkina FasoBurundiCabo VerdeCambodiaCameroonCanadaCaribbean small statesCentral African RepublicCentral Europe and the BalticsChadChileChinaColombiaComorosCongo, Dem. Rep.Congo, Rep.Costa RicaCote d'IvoireCroatiaCubaCyprusCzech RepublicDenmarkDjiboutiDominicaDominican RepublicEarly-demographic dividendEast Asia & PacificEast Asia & Pacific (excluding high income)East Asia & Pacific (IDA & IBRD countries)EcuadorEgypt, Arab Rep.El SalvadorEquatorial GuineaEritreaEstoniaEthiopiaEuro areaEurope & Central AsiaEurope & Central Asia (excluding high income)Europe & Central Asia (IDA & IBRD countries)European UnionFijiFinlandFragile and conflict affected situationsFranceFrench PolynesiaGabonGambia, TheGeorgiaGermanyGhanaGreeceGuatemalaGuineaGuinea-BissauGuyanaHaitiHeavily indebted poor countries (HIPC)High incomeHondurasHong Kong SAR, ChinaHungaryIBRD onlyIcelandIDA & IBRD totalIDA blendIDA onlyIDA totalIndiaIndonesiaIran, Islamic Rep.IraqIrelandIsraelItalyJamaicaJapanJordanKazakhstanKenyaKiribatiKorea, Rep.KuwaitKyrgyz RepublicLao PDRLate-demographic dividendLatin America & Caribbean Latin America & Caribbean (excluding high income)Latin America & the Caribbean (IDA & IBRD countries)LatviaLeast developed countries: UN classificationLebanonLesothoLiberiaLibyaLithuaniaLow & middle incomeLow incomeLower middle incomeLuxembourgMacedonia, FYRMadagascarMalawiMalaysiaMaldivesMaliMauritaniaMauritiusMexicoMicronesia, Fed. Sts.Middle East & North AfricaMiddle East & North Africa (excluding high income)Middle East & North Africa (IDA & IBRD countries)Middle incomeMoldovaMongoliaMoroccoMozambiqueMyanmarNamibiaNepalNetherlandsNew CaledoniaNew ZealandNicaraguaNigerNigeriaNorth AmericaNorwayOECD membersOmanOther small statesPacific island small statesPakistanPanamaPapua New GuineaParaguayPeruPhilippinesPolandPortugalPost-demographic dividendPre-demographic dividendQatarRomaniaRussian FederationRwandaSamoaSao Tome and PrincipeSaudi ArabiaSenegalSeychellesSierra LeoneSingaporeSlovak RepublicSloveniaSmall statesSolomon IslandsSomaliaSouth AfricaSouth AsiaSouth Asia (IDA & IBRD)SpainSri LankaSt. LuciaSt. Vincent and the GrenadinesSub-Saharan Africa Sub-Saharan Africa (excluding high income)Sub-Saharan Africa (IDA & IBRD countries)SudanSurinameSwazilandSwedenSwitzerlandSyrian Arab RepublicTajikistanTanzaniaThailandTogoTongaTrinidad and TobagoTunisiaTurkeyTurkmenistanUgandaUkraineUnited Arab EmiratesUnited KingdomUnited StatesUpper middle incomeUruguayUzbekistanVanuatuVenezuela, RBVietnamWorldYemen, Rep.ZambiaZimbabwe Timeline:
This timeline shows a graph from 1971 to 2015 of South Asia. No data until 1970. Number of actual observations by date: 45.
Source name:
World Development Indicators
Source organization:
World Bank staff estimates based on sources and methods in World Bank's "The Changing Wealth of Nations: Measuring Sustainable Development in the New Millennium" (2011).
Categories, topics:
Economy & Growth, Environment
Last updated:
apr 23, 2017
Indicators value changes by year
At the date of observation
Value
Absolute change
Change from previous value
jan 1, 1971
1.233
+1.233
0.0%
jan 1, 1972
0.846
-0.387
-31.42%
jan 1, 1973
0.85
+0.005
0.53%
jan 1, 1974
1.463
+0.612
72.05%
jan 1, 1975
1.446
-0.016
-1.1%
jan 1, 1976
3.429
+1.983
137.09%
jan 1, 1977
1.999
-1.431
-41.72%
jan 1, 1978
2.554
+0.555
27.79%
jan 1, 1979
2.284
-0.271
-10.59%
jan 1, 1980
2.28
-0.004
-0.17%
jan 1, 1981
2.477
+0.197
8.66%
jan 1, 1982
1.896
-0.581
-23.47%
jan 1, 1983
2.766
+0.871
45.92%
jan 1, 1984
1.663
-1.103
-39.87%
jan 1, 1985
1.548
-0.115
-6.92%
jan 1, 1986
1.019
-0.53
-34.21%
jan 1, 1987
1.59
+0.571
56.11%
jan 1, 1988
1.421
-0.169
-10.63%
jan 1, 1989
1.485
+0.064
4.5%
jan 1, 1990
1.413
-0.071
-4.8%
jan 1, 1991
2.188
+0.775
54.8%
jan 1, 1992
2.474
+0.286
13.07%
jan 1, 1993
2.423
-0.051
-2.08%
jan 1, 1994
2.353
-0.069
-2.87%
jan 1, 1995
1.772
-0.581
-24.7%
jan 1, 1996
1.919
+0.147
8.3%
jan 1, 1997
1.667
-0.252
-13.12%
jan 1, 1998
1.495
-0.172
-10.31%
jan 1, 1999
1.445
-0.051
-3.4%
jan 1, 2000
1.545
+0.101
6.98%
jan 1, 2001
1.348
-0.197
-12.75%
jan 1, 2002
1.339
-0.01
-0.72%
jan 1, 2003
1.509
+0.17
12.72%
jan 1, 2004
1.39
-0.119
-7.86%
jan 1, 2005
1.007
-0.383
-27.56%
jan 1, 2006
0.876
-0.131
-13.0%
jan 1, 2007
1.174
+0.298
33.96%
jan 1, 2008
1.304
+0.13
11.11%
jan 1, 2009
1.241
-0.063
-4.84%
jan 1, 2010
1.086
-0.155
-12.46%
jan 1, 2011
1.61
+0.523
48.16%
jan 1, 2012
1.503
-0.106
-6.6%
jan 1, 2013
1.31
-0.194
-12.89%
jan 1, 2014
1.151
-0.159
-12.11%
jan 1, 2015
1.568
+0.417
36.22%
Ranking of countries by current statistics by years


Comments: