29
/
en
AIzaSyAYiBZKx7MnpbEhh9jyipgxe19OcubqV5w
April 1, 2024
28849
East Asia & Pacific (IDA & IBRD countries)
TEA
false
2
1
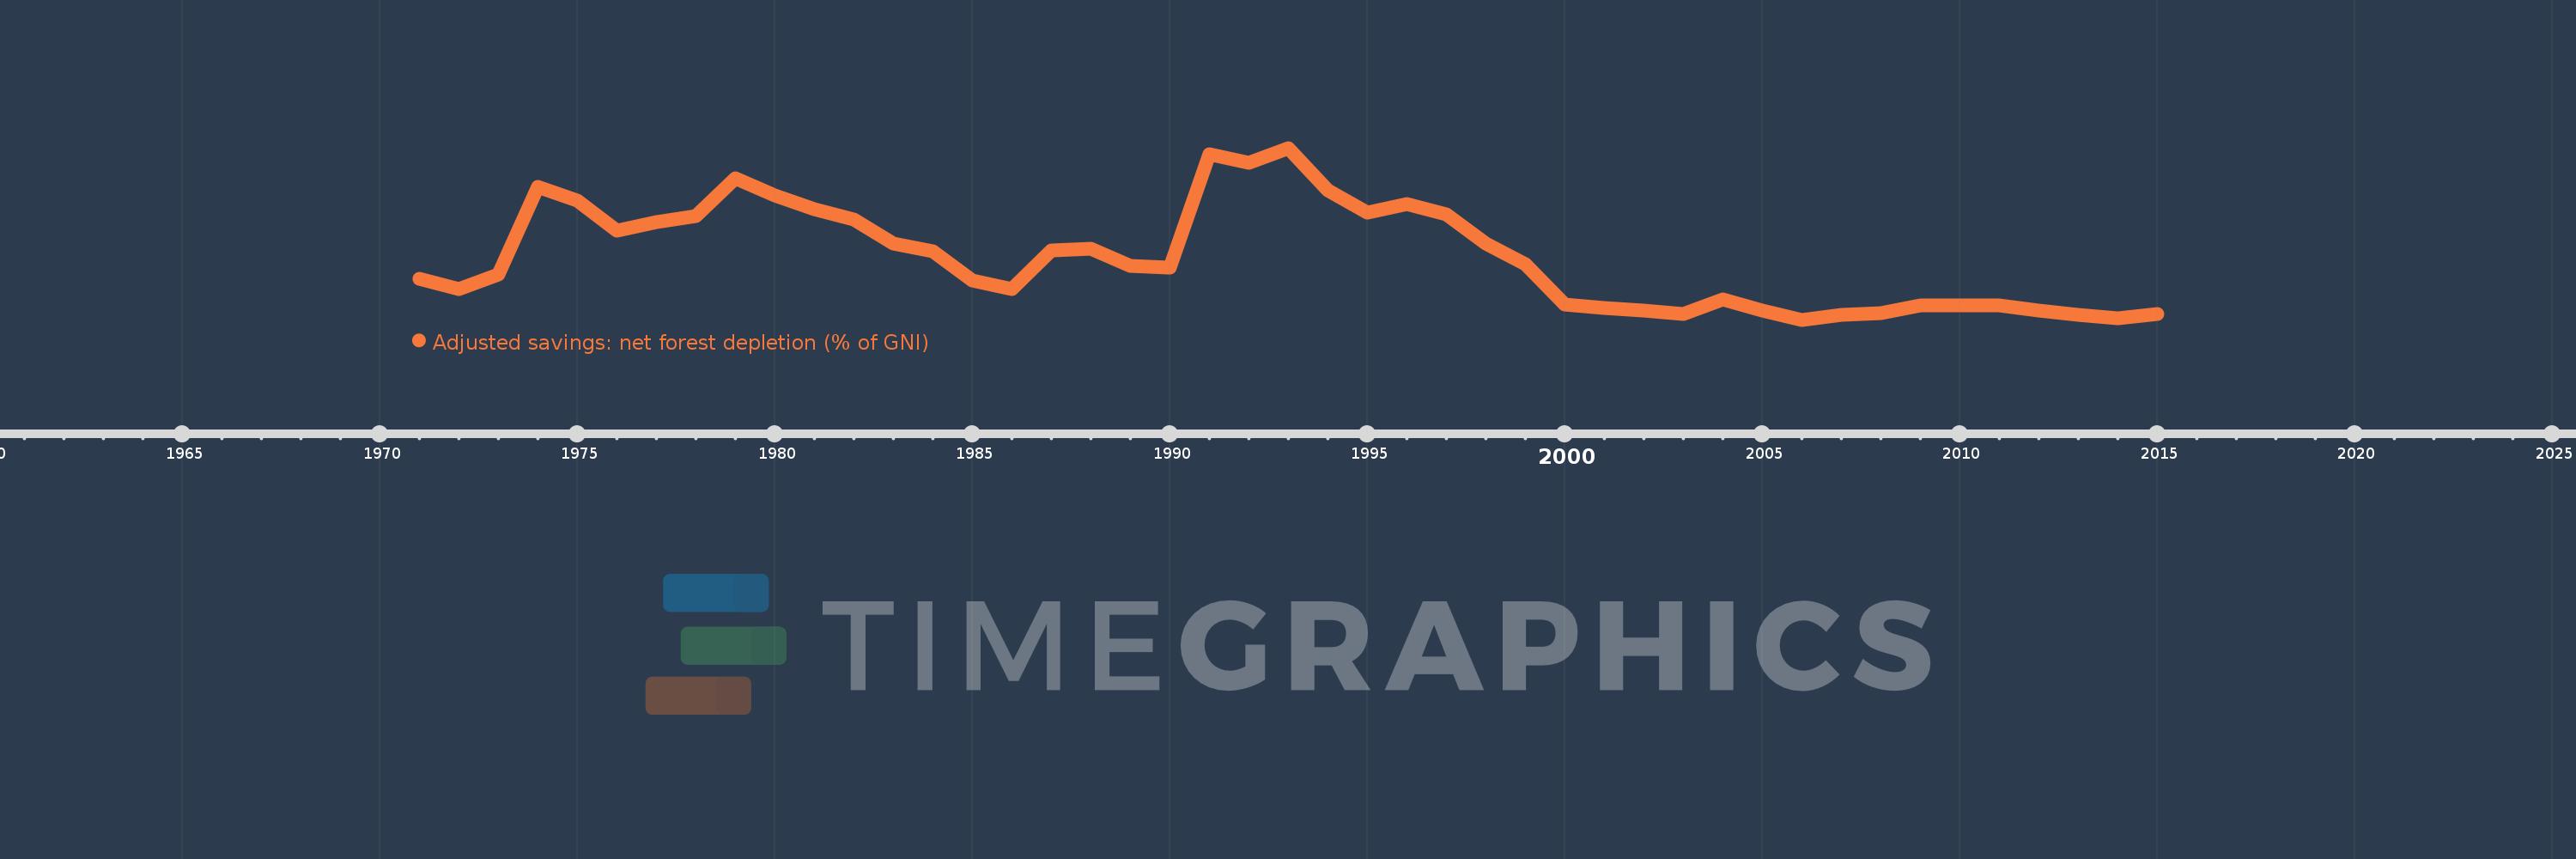
Adjusted savings: net forest depletion (% of GNI)
2015,2014,2013,2012,2011,2010,2009,2008,2007,2006,2005,2004,2003,2002,2001,2000,1999,1998,1997,1996,1995,1994,1993,1992,1991,1990,1989,1988,1987,1986,1985,1984,1983,1982,1981,1980,1979,1978,1977,1976,1975,1974,1973,1972,1971
This statistics in other country:
AfghanistanAlbaniaAlgeriaAngolaArab WorldArgentinaArmeniaAustraliaAustriaAzerbaijanBahamas, TheBahrainBangladeshBarbadosBelarusBelgiumBelizeBeninBhutanBoliviaBotswanaBrazilBrunei DarussalamBulgariaBurkina FasoBurundiCabo VerdeCambodiaCameroonCanadaCaribbean small statesCentral African RepublicCentral Europe and the BalticsChadChileChinaColombiaComorosCongo, Dem. Rep.Congo, Rep.Costa RicaCote d'IvoireCroatiaCubaCyprusCzech RepublicDenmarkDjiboutiDominicaDominican RepublicEarly-demographic dividendEast Asia & PacificEast Asia & Pacific (excluding high income)East Asia & Pacific (IDA & IBRD countries)EcuadorEgypt, Arab Rep.El SalvadorEquatorial GuineaEritreaEstoniaEthiopiaEuro areaEurope & Central AsiaEurope & Central Asia (excluding high income)Europe & Central Asia (IDA & IBRD countries)European UnionFijiFinlandFragile and conflict affected situationsFranceFrench PolynesiaGabonGambia, TheGeorgiaGermanyGhanaGreeceGuatemalaGuineaGuinea-BissauGuyanaHaitiHeavily indebted poor countries (HIPC)High incomeHondurasHong Kong SAR, ChinaHungaryIBRD onlyIcelandIDA & IBRD totalIDA blendIDA onlyIDA totalIndiaIndonesiaIran, Islamic Rep.IraqIrelandIsraelItalyJamaicaJapanJordanKazakhstanKenyaKiribatiKorea, Rep.KuwaitKyrgyz RepublicLao PDRLate-demographic dividendLatin America & Caribbean Latin America & Caribbean (excluding high income)Latin America & the Caribbean (IDA & IBRD countries)LatviaLeast developed countries: UN classificationLebanonLesothoLiberiaLibyaLithuaniaLow & middle incomeLow incomeLower middle incomeLuxembourgMacedonia, FYRMadagascarMalawiMalaysiaMaldivesMaliMauritaniaMauritiusMexicoMicronesia, Fed. Sts.Middle East & North AfricaMiddle East & North Africa (excluding high income)Middle East & North Africa (IDA & IBRD countries)Middle incomeMoldovaMongoliaMoroccoMozambiqueMyanmarNamibiaNepalNetherlandsNew CaledoniaNew ZealandNicaraguaNigerNigeriaNorth AmericaNorwayOECD membersOmanOther small statesPacific island small statesPakistanPanamaPapua New GuineaParaguayPeruPhilippinesPolandPortugalPost-demographic dividendPre-demographic dividendQatarRomaniaRussian FederationRwandaSamoaSao Tome and PrincipeSaudi ArabiaSenegalSeychellesSierra LeoneSingaporeSlovak RepublicSloveniaSmall statesSolomon IslandsSomaliaSouth AfricaSouth AsiaSouth Asia (IDA & IBRD)SpainSri LankaSt. LuciaSt. Vincent and the GrenadinesSub-Saharan Africa Sub-Saharan Africa (excluding high income)Sub-Saharan Africa (IDA & IBRD countries)SudanSurinameSwazilandSwedenSwitzerlandSyrian Arab RepublicTajikistanTanzaniaThailandTogoTongaTrinidad and TobagoTunisiaTurkeyTurkmenistanUgandaUkraineUnited Arab EmiratesUnited KingdomUnited StatesUpper middle incomeUruguayUzbekistanVanuatuVenezuela, RBVietnamWorldYemen, Rep.ZambiaZimbabwe Timeline:
This timeline shows a graph from 1971 to 2015 of East Asia & Pacific (IDA & IBRD countries). No data until 1970. Number of actual observations by date: 45.
Source name:
World Development Indicators
Source organization:
World Bank staff estimates based on sources and methods in World Bank's "The Changing Wealth of Nations: Measuring Sustainable Development in the New Millennium" (2011).
Categories, topics:
Economy & Growth, Environment
Last updated:
apr 23, 2017
Indicators value changes by year
At the date of observation
Value
Absolute change
Change from previous value
jan 1, 1971
0.238
+0.238
0.0%
jan 1, 1972
0.203
-0.035
-14.6%
jan 1, 1973
0.252
+0.049
23.9%
jan 1, 1974
0.541
+0.289
114.71%
jan 1, 1975
0.495
-0.046
-8.57%
jan 1, 1976
0.397
-0.098
-19.87%
jan 1, 1977
0.423
+0.026
6.55%
jan 1, 1978
0.444
+0.021
5.05%
jan 1, 1979
0.569
+0.125
28.24%
jan 1, 1980
0.512
-0.057
-10.01%
jan 1, 1981
0.467
-0.045
-8.82%
jan 1, 1982
0.433
-0.034
-7.24%
jan 1, 1983
0.354
-0.079
-18.32%
jan 1, 1984
0.327
-0.027
-7.51%
jan 1, 1985
0.231
-0.097
-29.55%
jan 1, 1986
0.204
-0.027
-11.55%
jan 1, 1987
0.332
+0.128
62.77%
jan 1, 1988
0.336
+0.004
1.23%
jan 1, 1989
0.28
-0.056
-16.72%
jan 1, 1990
0.275
-0.005
-1.83%
jan 1, 1991
0.646
+0.371
135.17%
jan 1, 1992
0.619
-0.027
-4.23%
jan 1, 1993
0.668
+0.049
8.0%
jan 1, 1994
0.528
-0.14
-20.94%
jan 1, 1995
0.456
-0.072
-13.67%
jan 1, 1996
0.483
+0.027
5.96%
jan 1, 1997
0.451
-0.033
-6.75%
jan 1, 1998
0.353
-0.098
-21.71%
jan 1, 1999
0.285
-0.067
-19.12%
jan 1, 2000
0.153
-0.132
-46.22%
jan 1, 2001
0.142
-0.012
-7.56%
jan 1, 2002
0.132
-0.01
-7.0%
jan 1, 2003
0.121
-0.011
-8.07%
jan 1, 2004
0.171
+0.05
40.9%
jan 1, 2005
0.132
-0.038
-22.51%
jan 1, 2006
0.103
-0.029
-22.02%
jan 1, 2007
0.12
+0.016
15.94%
jan 1, 2008
0.124
+0.004
3.56%
jan 1, 2009
0.151
+0.027
21.44%
jan 1, 2010
0.15
0.0
-0.08%
jan 1, 2011
0.151
+0.0
0.03%
jan 1, 2012
0.132
-0.018
-12.0%
jan 1, 2013
0.118
-0.015
-11.26%
jan 1, 2014
0.109
-0.009
-7.27%
jan 1, 2015
0.123
+0.014
13.07%
Ranking of countries by current statistics by years


Comments: