29
/
en
AIzaSyAYiBZKx7MnpbEhh9jyipgxe19OcubqV5w
April 1, 2024
43172
Latin America & the Caribbean (IDA & IBRD countries)
TLA
false
2
1
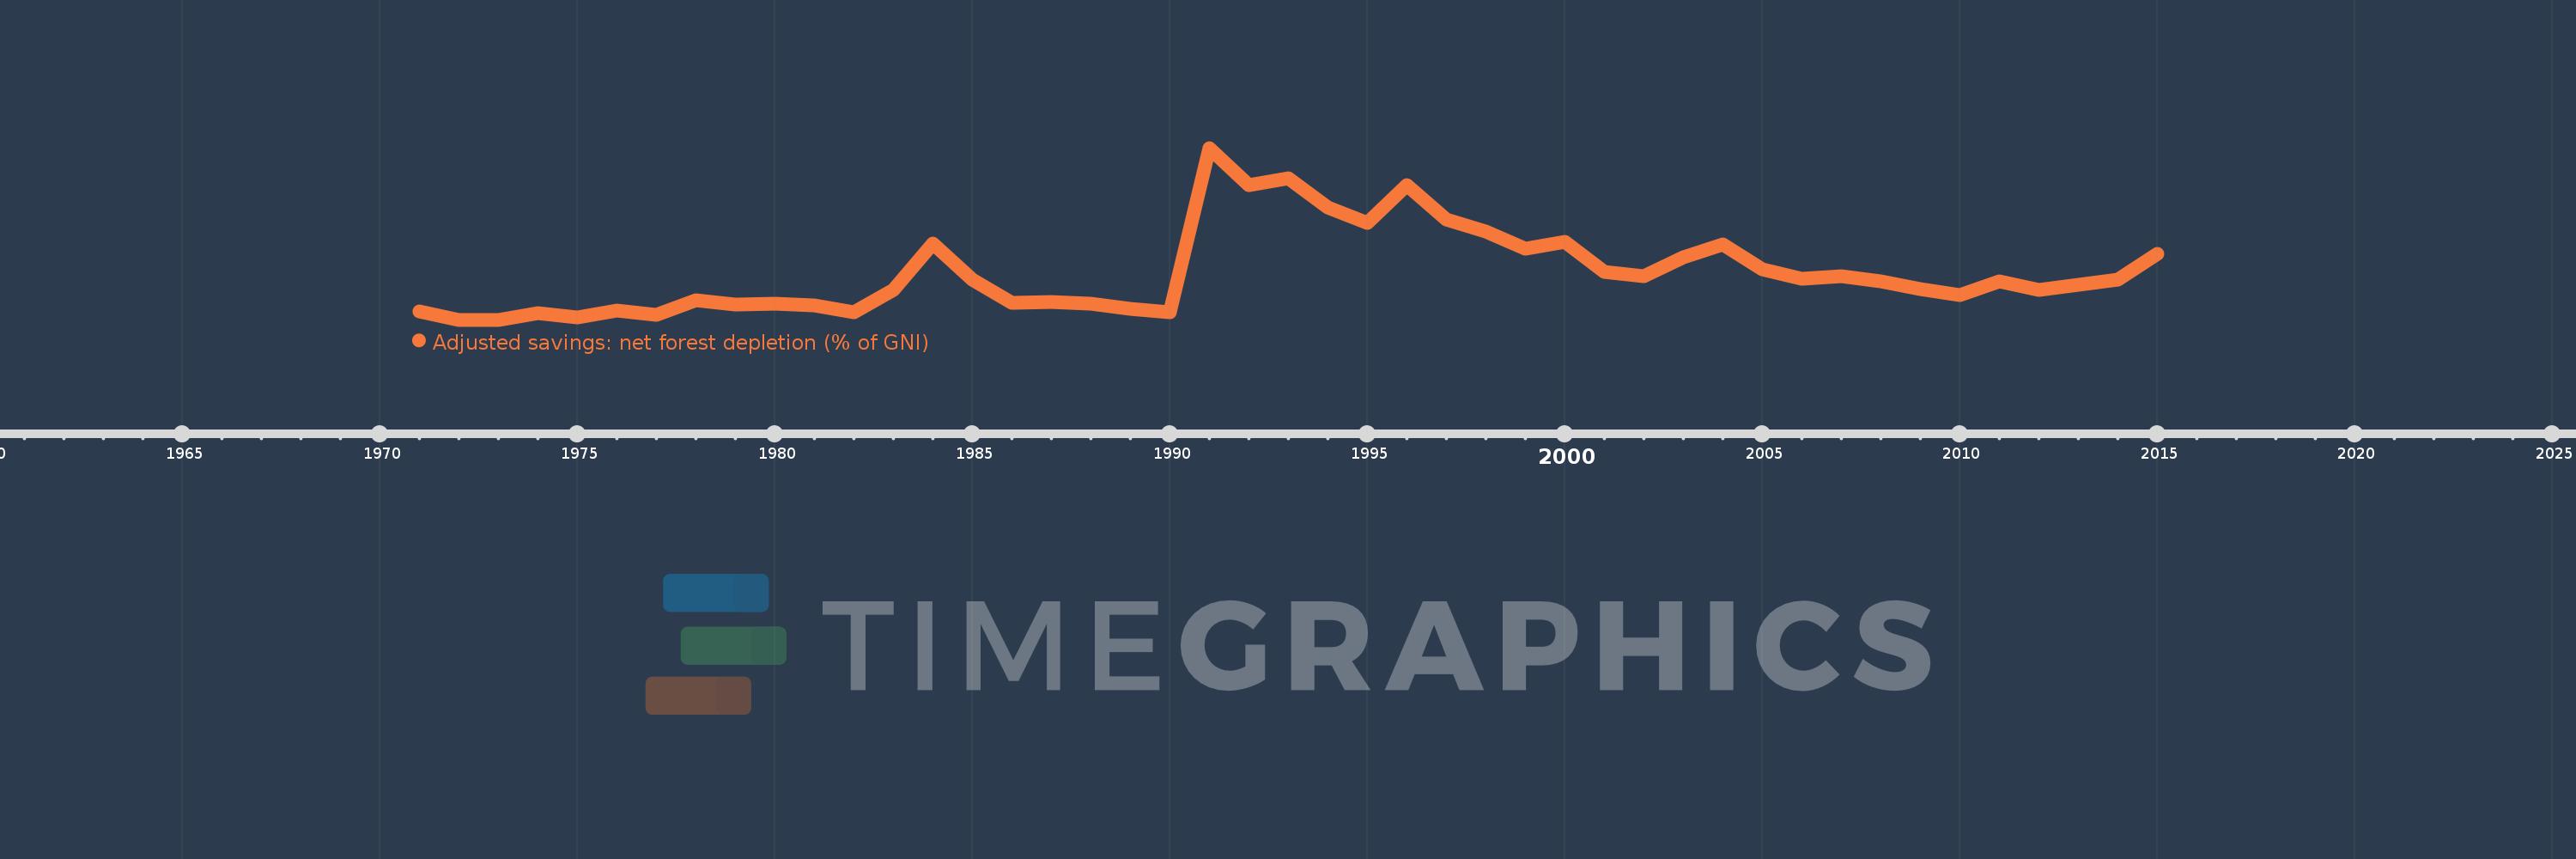
Adjusted savings: net forest depletion (% of GNI)
2015,2014,2013,2012,2011,2010,2009,2008,2007,2006,2005,2004,2003,2002,2001,2000,1999,1998,1997,1996,1995,1994,1993,1992,1991,1990,1989,1988,1987,1986,1985,1984,1983,1982,1981,1980,1979,1978,1977,1976,1975,1974,1973,1972,1971
This statistics in other country:
AfghanistanAlbaniaAlgeriaAngolaArab WorldArgentinaArmeniaAustraliaAustriaAzerbaijanBahamas, TheBahrainBangladeshBarbadosBelarusBelgiumBelizeBeninBhutanBoliviaBotswanaBrazilBrunei DarussalamBulgariaBurkina FasoBurundiCabo VerdeCambodiaCameroonCanadaCaribbean small statesCentral African RepublicCentral Europe and the BalticsChadChileChinaColombiaComorosCongo, Dem. Rep.Congo, Rep.Costa RicaCote d'IvoireCroatiaCubaCyprusCzech RepublicDenmarkDjiboutiDominicaDominican RepublicEarly-demographic dividendEast Asia & PacificEast Asia & Pacific (excluding high income)East Asia & Pacific (IDA & IBRD countries)EcuadorEgypt, Arab Rep.El SalvadorEquatorial GuineaEritreaEstoniaEthiopiaEuro areaEurope & Central AsiaEurope & Central Asia (excluding high income)Europe & Central Asia (IDA & IBRD countries)European UnionFijiFinlandFragile and conflict affected situationsFranceFrench PolynesiaGabonGambia, TheGeorgiaGermanyGhanaGreeceGuatemalaGuineaGuinea-BissauGuyanaHaitiHeavily indebted poor countries (HIPC)High incomeHondurasHong Kong SAR, ChinaHungaryIBRD onlyIcelandIDA & IBRD totalIDA blendIDA onlyIDA totalIndiaIndonesiaIran, Islamic Rep.IraqIrelandIsraelItalyJamaicaJapanJordanKazakhstanKenyaKiribatiKorea, Rep.KuwaitKyrgyz RepublicLao PDRLate-demographic dividendLatin America & Caribbean Latin America & Caribbean (excluding high income)Latin America & the Caribbean (IDA & IBRD countries)LatviaLeast developed countries: UN classificationLebanonLesothoLiberiaLibyaLithuaniaLow & middle incomeLow incomeLower middle incomeLuxembourgMacedonia, FYRMadagascarMalawiMalaysiaMaldivesMaliMauritaniaMauritiusMexicoMicronesia, Fed. Sts.Middle East & North AfricaMiddle East & North Africa (excluding high income)Middle East & North Africa (IDA & IBRD countries)Middle incomeMoldovaMongoliaMoroccoMozambiqueMyanmarNamibiaNepalNetherlandsNew CaledoniaNew ZealandNicaraguaNigerNigeriaNorth AmericaNorwayOECD membersOmanOther small statesPacific island small statesPakistanPanamaPapua New GuineaParaguayPeruPhilippinesPolandPortugalPost-demographic dividendPre-demographic dividendQatarRomaniaRussian FederationRwandaSamoaSao Tome and PrincipeSaudi ArabiaSenegalSeychellesSierra LeoneSingaporeSlovak RepublicSloveniaSmall statesSolomon IslandsSomaliaSouth AfricaSouth AsiaSouth Asia (IDA & IBRD)SpainSri LankaSt. LuciaSt. Vincent and the GrenadinesSub-Saharan Africa Sub-Saharan Africa (excluding high income)Sub-Saharan Africa (IDA & IBRD countries)SudanSurinameSwazilandSwedenSwitzerlandSyrian Arab RepublicTajikistanTanzaniaThailandTogoTongaTrinidad and TobagoTunisiaTurkeyTurkmenistanUgandaUkraineUnited Arab EmiratesUnited KingdomUnited StatesUpper middle incomeUruguayUzbekistanVanuatuVenezuela, RBVietnamWorldYemen, Rep.ZambiaZimbabwe Timeline:
This timeline shows a graph from 1971 to 2015 of Latin America & the Caribbean (IDA & IBRD countries). No data until 1970. Number of actual observations by date: 45.
Source name:
World Development Indicators
Source organization:
World Bank staff estimates based on sources and methods in World Bank's "The Changing Wealth of Nations: Measuring Sustainable Development in the New Millennium" (2011).
Categories, topics:
Economy & Growth, Environment
Last updated:
apr 23, 2017
Indicators value changes by year
At the date of observation
Value
Absolute change
Change from previous value
jan 1, 1971
0.102
+0.102
0.0%
jan 1, 1972
0.068
-0.033
-32.91%
jan 1, 1973
0.068
+0.0
0.47%
jan 1, 1974
0.096
+0.027
40.16%
jan 1, 1975
0.076
-0.02
-20.62%
jan 1, 1976
0.106
+0.03
39.67%
jan 1, 1977
0.088
-0.018
-16.81%
jan 1, 1978
0.148
+0.059
67.18%
jan 1, 1979
0.132
-0.015
-10.46%
jan 1, 1980
0.133
+0.001
0.69%
jan 1, 1981
0.127
-0.007
-5.11%
jan 1, 1982
0.098
-0.028
-22.29%
jan 1, 1983
0.193
+0.095
96.21%
jan 1, 1984
0.383
+0.191
98.75%
jan 1, 1985
0.234
-0.149
-38.9%
jan 1, 1986
0.138
-0.096
-41.1%
jan 1, 1987
0.143
+0.005
3.29%
jan 1, 1988
0.133
-0.009
-6.45%
jan 1, 1989
0.114
-0.019
-14.46%
jan 1, 1990
0.098
-0.016
-14.14%
jan 1, 1991
0.779
+0.681
694.98%
jan 1, 1992
0.625
-0.154
-19.79%
jan 1, 1993
0.655
+0.03
4.88%
jan 1, 1994
0.534
-0.121
-18.48%
jan 1, 1995
0.467
-0.067
-12.58%
jan 1, 1996
0.625
+0.158
33.93%
jan 1, 1997
0.482
-0.143
-22.82%
jan 1, 1998
0.432
-0.05
-10.41%
jan 1, 1999
0.362
-0.071
-16.31%
jan 1, 2000
0.392
+0.03
8.37%
jan 1, 2001
0.267
-0.125
-31.79%
jan 1, 2002
0.25
-0.018
-6.64%
jan 1, 2003
0.325
+0.075
30.23%
jan 1, 2004
0.378
+0.053
16.23%
jan 1, 2005
0.276
-0.102
-26.89%
jan 1, 2006
0.236
-0.04
-14.64%
jan 1, 2007
0.248
+0.012
5.04%
jan 1, 2008
0.228
-0.019
-7.79%
jan 1, 2009
0.195
-0.033
-14.57%
jan 1, 2010
0.169
-0.026
-13.55%
jan 1, 2011
0.227
+0.059
34.79%
jan 1, 2012
0.192
-0.036
-15.76%
jan 1, 2013
0.212
+0.021
10.83%
jan 1, 2014
0.234
+0.021
10.04%
jan 1, 2015
0.339
+0.106
45.31%
Ranking of countries by current statistics by years


Comments: