29
/
en
AIzaSyAYiBZKx7MnpbEhh9jyipgxe19OcubqV5w
April 1, 2024
230632
Rwanda
RWA
true
2
1
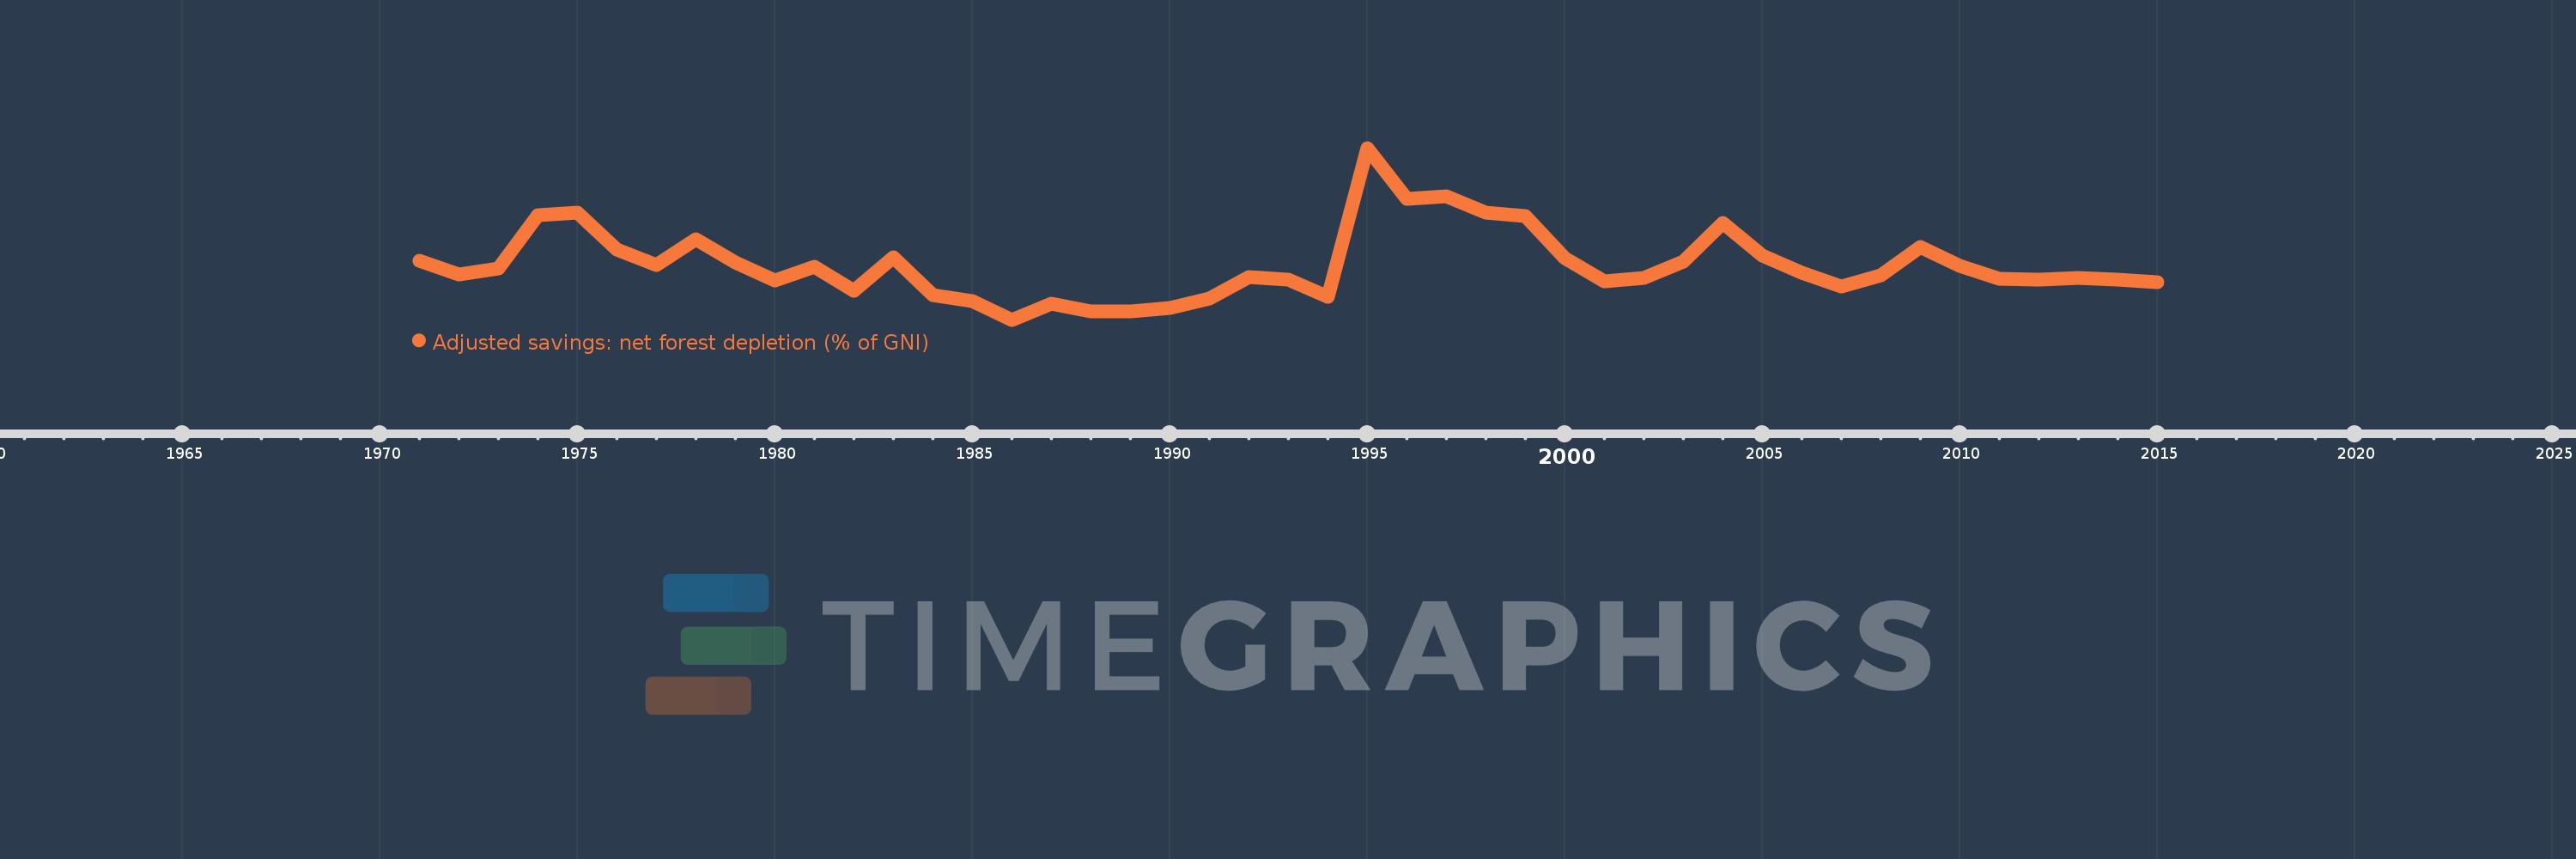
Adjusted savings: net forest depletion (% of GNI)
2015,2014,2013,2012,2011,2010,2009,2008,2007,2006,2005,2004,2003,2002,2001,2000,1999,1998,1997,1996,1995,1994,1993,1992,1991,1990,1989,1988,1987,1986,1985,1984,1983,1982,1981,1980,1979,1978,1977,1976,1975,1974,1973,1972,1971
This statistics in other country:
AfghanistanAlbaniaAlgeriaAngolaArab WorldArgentinaArmeniaAustraliaAustriaAzerbaijanBahamas, TheBahrainBangladeshBarbadosBelarusBelgiumBelizeBeninBhutanBoliviaBotswanaBrazilBrunei DarussalamBulgariaBurkina FasoBurundiCabo VerdeCambodiaCameroonCanadaCaribbean small statesCentral African RepublicCentral Europe and the BalticsChadChileChinaColombiaComorosCongo, Dem. Rep.Congo, Rep.Costa RicaCote d'IvoireCroatiaCubaCyprusCzech RepublicDenmarkDjiboutiDominicaDominican RepublicEarly-demographic dividendEast Asia & PacificEast Asia & Pacific (excluding high income)East Asia & Pacific (IDA & IBRD countries)EcuadorEgypt, Arab Rep.El SalvadorEquatorial GuineaEritreaEstoniaEthiopiaEuro areaEurope & Central AsiaEurope & Central Asia (excluding high income)Europe & Central Asia (IDA & IBRD countries)European UnionFijiFinlandFragile and conflict affected situationsFranceFrench PolynesiaGabonGambia, TheGeorgiaGermanyGhanaGreeceGuatemalaGuineaGuinea-BissauGuyanaHaitiHeavily indebted poor countries (HIPC)High incomeHondurasHong Kong SAR, ChinaHungaryIBRD onlyIcelandIDA & IBRD totalIDA blendIDA onlyIDA totalIndiaIndonesiaIran, Islamic Rep.IraqIrelandIsraelItalyJamaicaJapanJordanKazakhstanKenyaKiribatiKorea, Rep.KuwaitKyrgyz RepublicLao PDRLate-demographic dividendLatin America & Caribbean Latin America & Caribbean (excluding high income)Latin America & the Caribbean (IDA & IBRD countries)LatviaLeast developed countries: UN classificationLebanonLesothoLiberiaLibyaLithuaniaLow & middle incomeLow incomeLower middle incomeLuxembourgMacedonia, FYRMadagascarMalawiMalaysiaMaldivesMaliMauritaniaMauritiusMexicoMicronesia, Fed. Sts.Middle East & North AfricaMiddle East & North Africa (excluding high income)Middle East & North Africa (IDA & IBRD countries)Middle incomeMoldovaMongoliaMoroccoMozambiqueMyanmarNamibiaNepalNetherlandsNew CaledoniaNew ZealandNicaraguaNigerNigeriaNorth AmericaNorwayOECD membersOmanOther small statesPacific island small statesPakistanPanamaPapua New GuineaParaguayPeruPhilippinesPolandPortugalPost-demographic dividendPre-demographic dividendQatarRomaniaRussian FederationRwandaSamoaSao Tome and PrincipeSaudi ArabiaSenegalSeychellesSierra LeoneSingaporeSlovak RepublicSloveniaSmall statesSolomon IslandsSomaliaSouth AfricaSouth AsiaSouth Asia (IDA & IBRD)SpainSri LankaSt. LuciaSt. Vincent and the GrenadinesSub-Saharan Africa Sub-Saharan Africa (excluding high income)Sub-Saharan Africa (IDA & IBRD countries)SudanSurinameSwazilandSwedenSwitzerlandSyrian Arab RepublicTajikistanTanzaniaThailandTogoTongaTrinidad and TobagoTunisiaTurkeyTurkmenistanUgandaUkraineUnited Arab EmiratesUnited KingdomUnited StatesUpper middle incomeUruguayUzbekistanVanuatuVenezuela, RBVietnamWorldYemen, Rep.ZambiaZimbabwe Timeline:
This timeline shows a graph from 1971 to 2015 of Rwanda. No data until 1970. Number of actual observations by date: 45.
Source name:
World Development Indicators
Source organization:
World Bank staff estimates based on sources and methods in World Bank's "The Changing Wealth of Nations: Measuring Sustainable Development in the New Millennium" (2011).
Categories, topics:
Economy & Growth, Environment
Last updated:
apr 23, 2017
Indicators value changes by year
Maximum:
15.467
jan 1, 1995
At the date of observation
Value
Absolute change
Change from previous value
jan 1, 1971
7.143
+7.143
0.0%
jan 1, 1972
6.174
-0.97
-13.58%
jan 1, 1973
6.637
+0.463
7.5%
jan 1, 1974
10.512
+3.876
58.4%
jan 1, 1975
10.722
+0.21
2.0%
jan 1, 1976
8.019
-2.703
-25.21%
jan 1, 1977
6.84
-1.179
-14.7%
jan 1, 1978
8.749
+1.909
27.91%
jan 1, 1979
7.036
-1.713
-19.58%
jan 1, 1980
5.725
-1.311
-18.64%
jan 1, 1981
6.714
+0.989
17.28%
jan 1, 1982
4.951
-1.763
-26.26%
jan 1, 1983
7.452
+2.501
50.52%
jan 1, 1984
4.641
-2.811
-37.73%
jan 1, 1985
4.193
-0.448
-9.65%
jan 1, 1986
2.835
-1.358
-32.38%
jan 1, 1987
4.023
+1.187
41.87%
jan 1, 1988
3.475
-0.547
-13.6%
jan 1, 1989
3.47
-0.006
-0.16%
jan 1, 1990
3.73
+0.26
7.51%
jan 1, 1991
4.37
+0.64
17.15%
jan 1, 1992
5.978
+1.607
36.78%
jan 1, 1993
5.803
-0.175
-2.92%
jan 1, 1994
4.5
-1.303
-22.46%
jan 1, 1995
15.467
+10.967
243.73%
jan 1, 1996
11.73
-3.737
-24.16%
jan 1, 1997
11.924
+0.194
1.66%
jan 1, 1998
10.683
-1.241
-10.41%
jan 1, 1999
10.452
-0.231
-2.16%
jan 1, 2000
7.375
-3.077
-29.44%
jan 1, 2001
5.641
-1.734
-23.51%
jan 1, 2002
5.94
+0.299
5.29%
jan 1, 2003
7.13
+1.19
20.03%
jan 1, 2004
9.953
+2.823
39.6%
jan 1, 2005
7.525
-2.428
-24.4%
jan 1, 2006
6.263
-1.262
-16.76%
jan 1, 2007
5.275
-0.988
-15.78%
jan 1, 2008
6.105
+0.83
15.74%
jan 1, 2009
8.167
+2.062
33.78%
jan 1, 2010
6.785
-1.382
-16.93%
jan 1, 2011
5.874
-0.91
-13.42%
jan 1, 2012
5.8
-0.075
-1.27%
jan 1, 2013
5.897
+0.097
1.68%
jan 1, 2014
5.785
-0.111
-1.89%
jan 1, 2015
5.588
-0.197
-3.41%
Ranking of countries by current statistics by years


Comments: