29
/
en
AIzaSyAYiBZKx7MnpbEhh9jyipgxe19OcubqV5w
April 1, 2024
261832
Thailand
THA
true
2
1
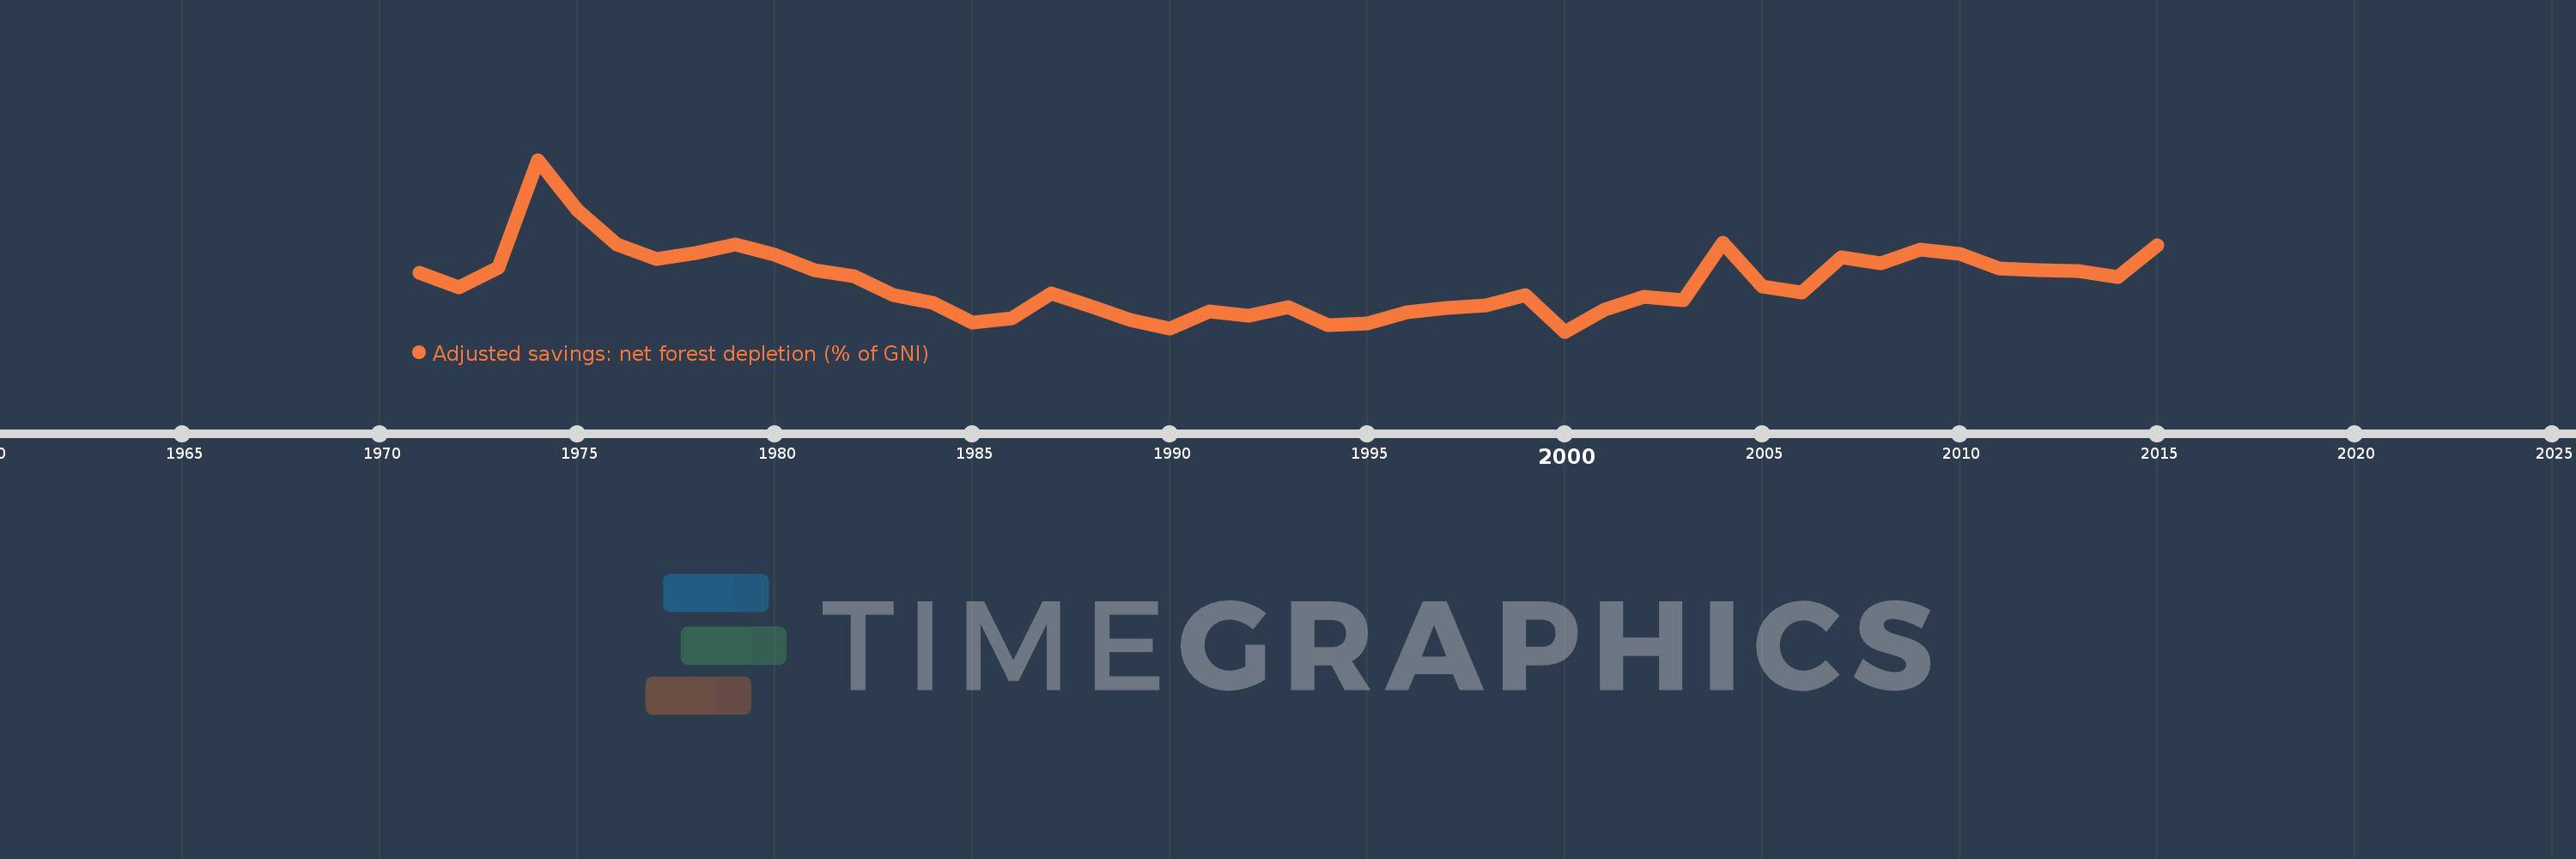
Adjusted savings: net forest depletion (% of GNI)
2015,2014,2013,2012,2011,2010,2009,2008,2007,2006,2005,2004,2003,2002,2001,2000,1999,1998,1997,1996,1995,1994,1993,1992,1991,1990,1989,1988,1987,1986,1985,1984,1983,1982,1981,1980,1979,1978,1977,1976,1975,1974,1973,1972,1971
This statistics in other country:
AfghanistanAlbaniaAlgeriaAngolaArab WorldArgentinaArmeniaAustraliaAustriaAzerbaijanBahamas, TheBahrainBangladeshBarbadosBelarusBelgiumBelizeBeninBhutanBoliviaBotswanaBrazilBrunei DarussalamBulgariaBurkina FasoBurundiCabo VerdeCambodiaCameroonCanadaCaribbean small statesCentral African RepublicCentral Europe and the BalticsChadChileChinaColombiaComorosCongo, Dem. Rep.Congo, Rep.Costa RicaCote d'IvoireCroatiaCubaCyprusCzech RepublicDenmarkDjiboutiDominicaDominican RepublicEarly-demographic dividendEast Asia & PacificEast Asia & Pacific (excluding high income)East Asia & Pacific (IDA & IBRD countries)EcuadorEgypt, Arab Rep.El SalvadorEquatorial GuineaEritreaEstoniaEthiopiaEuro areaEurope & Central AsiaEurope & Central Asia (excluding high income)Europe & Central Asia (IDA & IBRD countries)European UnionFijiFinlandFragile and conflict affected situationsFranceFrench PolynesiaGabonGambia, TheGeorgiaGermanyGhanaGreeceGuatemalaGuineaGuinea-BissauGuyanaHaitiHeavily indebted poor countries (HIPC)High incomeHondurasHong Kong SAR, ChinaHungaryIBRD onlyIcelandIDA & IBRD totalIDA blendIDA onlyIDA totalIndiaIndonesiaIran, Islamic Rep.IraqIrelandIsraelItalyJamaicaJapanJordanKazakhstanKenyaKiribatiKorea, Rep.KuwaitKyrgyz RepublicLao PDRLate-demographic dividendLatin America & Caribbean Latin America & Caribbean (excluding high income)Latin America & the Caribbean (IDA & IBRD countries)LatviaLeast developed countries: UN classificationLebanonLesothoLiberiaLibyaLithuaniaLow & middle incomeLow incomeLower middle incomeLuxembourgMacedonia, FYRMadagascarMalawiMalaysiaMaldivesMaliMauritaniaMauritiusMexicoMicronesia, Fed. Sts.Middle East & North AfricaMiddle East & North Africa (excluding high income)Middle East & North Africa (IDA & IBRD countries)Middle incomeMoldovaMongoliaMoroccoMozambiqueMyanmarNamibiaNepalNetherlandsNew CaledoniaNew ZealandNicaraguaNigerNigeriaNorth AmericaNorwayOECD membersOmanOther small statesPacific island small statesPakistanPanamaPapua New GuineaParaguayPeruPhilippinesPolandPortugalPost-demographic dividendPre-demographic dividendQatarRomaniaRussian FederationRwandaSamoaSao Tome and PrincipeSaudi ArabiaSenegalSeychellesSierra LeoneSingaporeSlovak RepublicSloveniaSmall statesSolomon IslandsSomaliaSouth AfricaSouth AsiaSouth Asia (IDA & IBRD)SpainSri LankaSt. LuciaSt. Vincent and the GrenadinesSub-Saharan Africa Sub-Saharan Africa (excluding high income)Sub-Saharan Africa (IDA & IBRD countries)SudanSurinameSwazilandSwedenSwitzerlandSyrian Arab RepublicTajikistanTanzaniaThailandTogoTongaTrinidad and TobagoTunisiaTurkeyTurkmenistanUgandaUkraineUnited Arab EmiratesUnited KingdomUnited StatesUpper middle incomeUruguayUzbekistanVanuatuVenezuela, RBVietnamWorldYemen, Rep.ZambiaZimbabwe Timeline:
This timeline shows a graph from 1971 to 2015 of Thailand. No data until 1970. Number of actual observations by date: 45.
Source name:
World Development Indicators
Source organization:
World Bank staff estimates based on sources and methods in World Bank's "The Changing Wealth of Nations: Measuring Sustainable Development in the New Millennium" (2011).
Categories, topics:
Economy & Growth, Environment
Last updated:
apr 23, 2017
Indicators value changes by year
At the date of observation
Value
Absolute change
Change from previous value
jan 1, 1971
0.736
+0.736
0.0%
jan 1, 1972
0.635
-0.101
-13.77%
jan 1, 1973
0.774
+0.139
21.93%
jan 1, 1974
1.546
+0.772
99.82%
jan 1, 1975
1.183
-0.363
-23.5%
jan 1, 1976
0.94
-0.243
-20.52%
jan 1, 1977
0.834
-0.106
-11.25%
jan 1, 1978
0.876
+0.042
5.03%
jan 1, 1979
0.938
+0.062
7.02%
jan 1, 1980
0.865
-0.073
-7.82%
jan 1, 1981
0.758
-0.107
-12.35%
jan 1, 1982
0.709
-0.049
-6.44%
jan 1, 1983
0.578
-0.131
-18.45%
jan 1, 1984
0.521
-0.057
-9.85%
jan 1, 1985
0.38
-0.142
-27.18%
jan 1, 1986
0.409
+0.029
7.64%
jan 1, 1987
0.588
+0.18
43.94%
jan 1, 1988
0.497
-0.091
-15.55%
jan 1, 1989
0.401
-0.095
-19.18%
jan 1, 1990
0.336
-0.065
-16.2%
jan 1, 1991
0.458
+0.121
36.09%
jan 1, 1992
0.429
-0.029
-6.25%
jan 1, 1993
0.491
+0.062
14.47%
jan 1, 1994
0.361
-0.13
-26.42%
jan 1, 1995
0.375
+0.014
3.87%
jan 1, 1996
0.454
+0.078
20.83%
jan 1, 1997
0.485
+0.031
6.92%
jan 1, 1998
0.505
+0.02
4.19%
jan 1, 1999
0.576
+0.07
13.91%
jan 1, 2000
0.315
-0.261
-45.29%
jan 1, 2001
0.469
+0.154
48.9%
jan 1, 2002
0.562
+0.093
19.75%
jan 1, 2003
0.538
-0.023
-4.16%
jan 1, 2004
0.949
+0.411
76.32%
jan 1, 2005
0.639
-0.31
-32.71%
jan 1, 2006
0.594
-0.044
-6.92%
jan 1, 2007
0.847
+0.253
42.51%
jan 1, 2008
0.805
-0.042
-4.93%
jan 1, 2009
0.901
+0.095
11.81%
jan 1, 2010
0.871
-0.03
-3.3%
jan 1, 2011
0.77
-0.101
-11.62%
jan 1, 2012
0.758
-0.011
-1.46%
jan 1, 2013
0.747
-0.011
-1.46%
jan 1, 2014
0.703
-0.044
-5.88%
jan 1, 2015
0.931
+0.227
32.34%
Ranking of countries by current statistics by years


Comments: