29
/
en
AIzaSyAYiBZKx7MnpbEhh9jyipgxe19OcubqV5w
April 1, 2024
53913
Pacific island small states
PSS
false
2
1
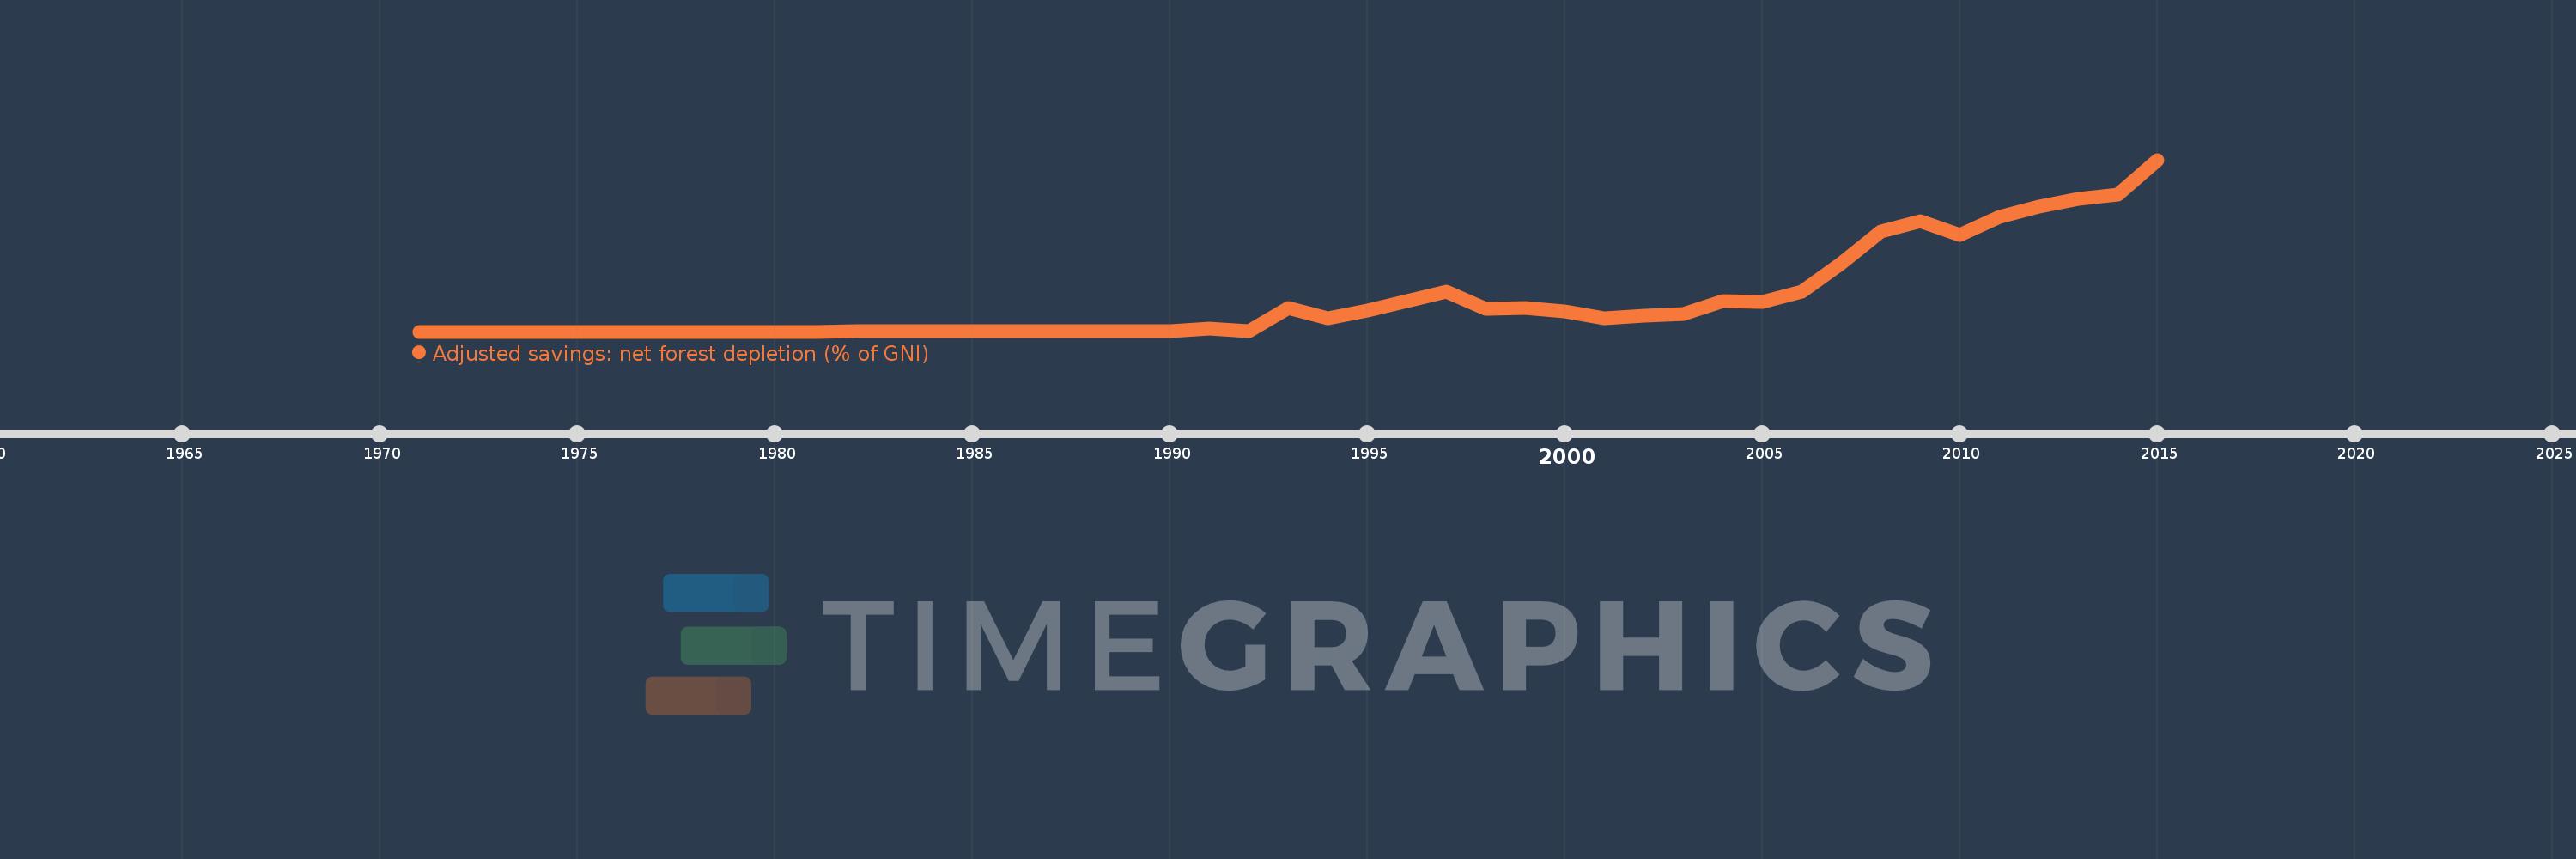
Adjusted savings: net forest depletion (% of GNI)
2015,2014,2013,2012,2011,2010,2009,2008,2007,2006,2005,2004,2003,2002,2001,2000,1999,1998,1997,1996,1995,1994,1993,1992,1991,1990,1989,1988,1987,1986,1985,1984,1983,1982,1981,1980,1979,1978,1977,1976,1975,1974,1973,1972,1971
This statistics in other country:
AfghanistanAlbaniaAlgeriaAngolaArab WorldArgentinaArmeniaAustraliaAustriaAzerbaijanBahamas, TheBahrainBangladeshBarbadosBelarusBelgiumBelizeBeninBhutanBoliviaBotswanaBrazilBrunei DarussalamBulgariaBurkina FasoBurundiCabo VerdeCambodiaCameroonCanadaCaribbean small statesCentral African RepublicCentral Europe and the BalticsChadChileChinaColombiaComorosCongo, Dem. Rep.Congo, Rep.Costa RicaCote d'IvoireCroatiaCubaCyprusCzech RepublicDenmarkDjiboutiDominicaDominican RepublicEarly-demographic dividendEast Asia & PacificEast Asia & Pacific (excluding high income)East Asia & Pacific (IDA & IBRD countries)EcuadorEgypt, Arab Rep.El SalvadorEquatorial GuineaEritreaEstoniaEthiopiaEuro areaEurope & Central AsiaEurope & Central Asia (excluding high income)Europe & Central Asia (IDA & IBRD countries)European UnionFijiFinlandFragile and conflict affected situationsFranceFrench PolynesiaGabonGambia, TheGeorgiaGermanyGhanaGreeceGuatemalaGuineaGuinea-BissauGuyanaHaitiHeavily indebted poor countries (HIPC)High incomeHondurasHong Kong SAR, ChinaHungaryIBRD onlyIcelandIDA & IBRD totalIDA blendIDA onlyIDA totalIndiaIndonesiaIran, Islamic Rep.IraqIrelandIsraelItalyJamaicaJapanJordanKazakhstanKenyaKiribatiKorea, Rep.KuwaitKyrgyz RepublicLao PDRLate-demographic dividendLatin America & Caribbean Latin America & Caribbean (excluding high income)Latin America & the Caribbean (IDA & IBRD countries)LatviaLeast developed countries: UN classificationLebanonLesothoLiberiaLibyaLithuaniaLow & middle incomeLow incomeLower middle incomeLuxembourgMacedonia, FYRMadagascarMalawiMalaysiaMaldivesMaliMauritaniaMauritiusMexicoMicronesia, Fed. Sts.Middle East & North AfricaMiddle East & North Africa (excluding high income)Middle East & North Africa (IDA & IBRD countries)Middle incomeMoldovaMongoliaMoroccoMozambiqueMyanmarNamibiaNepalNetherlandsNew CaledoniaNew ZealandNicaraguaNigerNigeriaNorth AmericaNorwayOECD membersOmanOther small statesPacific island small statesPakistanPanamaPapua New GuineaParaguayPeruPhilippinesPolandPortugalPost-demographic dividendPre-demographic dividendQatarRomaniaRussian FederationRwandaSamoaSao Tome and PrincipeSaudi ArabiaSenegalSeychellesSierra LeoneSingaporeSlovak RepublicSloveniaSmall statesSolomon IslandsSomaliaSouth AfricaSouth AsiaSouth Asia (IDA & IBRD)SpainSri LankaSt. LuciaSt. Vincent and the GrenadinesSub-Saharan Africa Sub-Saharan Africa (excluding high income)Sub-Saharan Africa (IDA & IBRD countries)SudanSurinameSwazilandSwedenSwitzerlandSyrian Arab RepublicTajikistanTanzaniaThailandTogoTongaTrinidad and TobagoTunisiaTurkeyTurkmenistanUgandaUkraineUnited Arab EmiratesUnited KingdomUnited StatesUpper middle incomeUruguayUzbekistanVanuatuVenezuela, RBVietnamWorldYemen, Rep.ZambiaZimbabwe Timeline:
This timeline shows a graph from 1971 to 2015 of Pacific island small states. No data until 1970. Number of actual observations by date: 45.
Source name:
World Development Indicators
Source organization:
World Bank staff estimates based on sources and methods in World Bank's "The Changing Wealth of Nations: Measuring Sustainable Development in the New Millennium" (2011).
Categories, topics:
Economy & Growth, Environment
Last updated:
apr 23, 2017
Indicators value changes by year
At the date of observation
Value
Absolute change
Change from previous value
jan 1, 1982
0.002
+0.002
%
jan 1, 1983
0.001
0.0
-11.18%
jan 1, 1984
0.001
+0.0
3.94%
jan 1, 1985
0.001
0.0
-30.4%
jan 1, 1986
0.001
+0.0
1.41%
jan 1, 1987
0.001
+0.0
46.72%
jan 1, 1988
0.002
+0.0
5.93%
jan 1, 1989
0.002
+0.0
0.09%
jan 1, 1990
0.001
0.0
-3.9%
jan 1, 1991
0.068
+0.066
4.48K%
jan 1, 1992
0.007
-0.061
-89.26%
jan 1, 1993
0.595
+0.588
8.07K%
jan 1, 1994
0.337
-0.258
-43.41%
jan 1, 1995
0.518
+0.182
53.91%
jan 1, 1996
0.754
+0.236
45.48%
jan 1, 1997
0.992
+0.238
31.56%
jan 1, 1998
0.574
-0.418
-42.16%
jan 1, 1999
0.576
+0.002
0.37%
jan 1, 2000
0.501
-0.075
-13.02%
jan 1, 2001
0.324
-0.176
-35.23%
jan 1, 2002
0.387
+0.063
19.27%
jan 1, 2003
0.444
+0.057
14.61%
jan 1, 2004
0.765
+0.321
72.41%
jan 1, 2005
0.733
-0.032
-4.19%
jan 1, 2006
0.99
+0.257
35.11%
jan 1, 2007
1.68
+0.69
69.74%
jan 1, 2008
2.467
+0.787
46.84%
jan 1, 2009
2.736
+0.269
10.89%
jan 1, 2010
2.4
-0.336
-12.27%
jan 1, 2011
2.848
+0.448
18.67%
jan 1, 2012
3.085
+0.237
8.31%
jan 1, 2013
3.275
+0.19
6.16%
jan 1, 2014
3.394
+0.119
3.64%
jan 1, 2015
4.252
+0.857
25.26%
Ranking of countries by current statistics by years


Comments: