29
/
en
AIzaSyAYiBZKx7MnpbEhh9jyipgxe19OcubqV5w
April 1, 2024
111828
Costa Rica
CRI
true
2
1
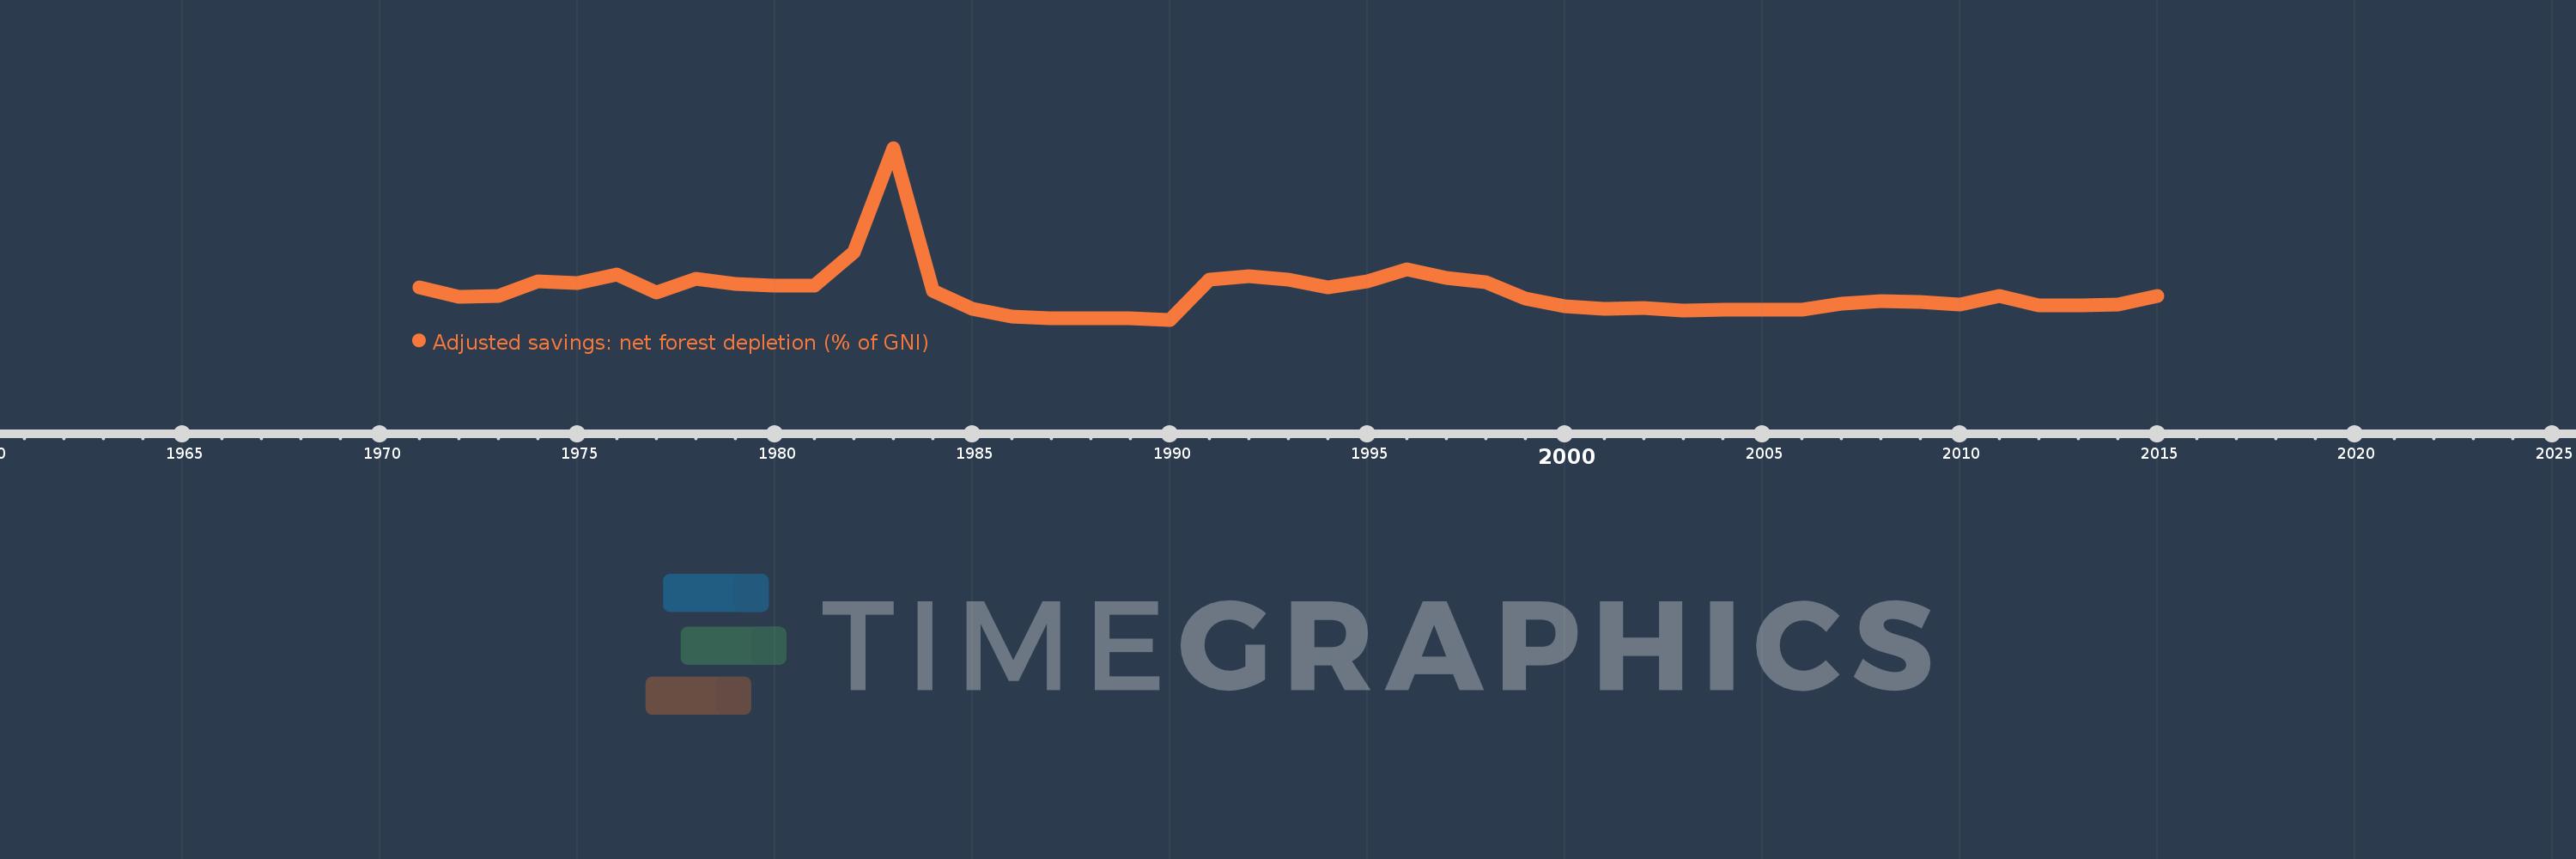
Adjusted savings: net forest depletion (% of GNI)
2015,2014,2013,2012,2011,2010,2009,2008,2007,2006,2005,2004,2003,2002,2001,2000,1999,1998,1997,1996,1995,1994,1993,1992,1991,1990,1989,1988,1987,1986,1985,1984,1983,1982,1981,1980,1979,1978,1977,1976,1975,1974,1973,1972,1971
This statistics in other country:
AfghanistanAlbaniaAlgeriaAngolaArab WorldArgentinaArmeniaAustraliaAustriaAzerbaijanBahamas, TheBahrainBangladeshBarbadosBelarusBelgiumBelizeBeninBhutanBoliviaBotswanaBrazilBrunei DarussalamBulgariaBurkina FasoBurundiCabo VerdeCambodiaCameroonCanadaCaribbean small statesCentral African RepublicCentral Europe and the BalticsChadChileChinaColombiaComorosCongo, Dem. Rep.Congo, Rep.Costa RicaCote d'IvoireCroatiaCubaCyprusCzech RepublicDenmarkDjiboutiDominicaDominican RepublicEarly-demographic dividendEast Asia & PacificEast Asia & Pacific (excluding high income)East Asia & Pacific (IDA & IBRD countries)EcuadorEgypt, Arab Rep.El SalvadorEquatorial GuineaEritreaEstoniaEthiopiaEuro areaEurope & Central AsiaEurope & Central Asia (excluding high income)Europe & Central Asia (IDA & IBRD countries)European UnionFijiFinlandFragile and conflict affected situationsFranceFrench PolynesiaGabonGambia, TheGeorgiaGermanyGhanaGreeceGuatemalaGuineaGuinea-BissauGuyanaHaitiHeavily indebted poor countries (HIPC)High incomeHondurasHong Kong SAR, ChinaHungaryIBRD onlyIcelandIDA & IBRD totalIDA blendIDA onlyIDA totalIndiaIndonesiaIran, Islamic Rep.IraqIrelandIsraelItalyJamaicaJapanJordanKazakhstanKenyaKiribatiKorea, Rep.KuwaitKyrgyz RepublicLao PDRLate-demographic dividendLatin America & Caribbean Latin America & Caribbean (excluding high income)Latin America & the Caribbean (IDA & IBRD countries)LatviaLeast developed countries: UN classificationLebanonLesothoLiberiaLibyaLithuaniaLow & middle incomeLow incomeLower middle incomeLuxembourgMacedonia, FYRMadagascarMalawiMalaysiaMaldivesMaliMauritaniaMauritiusMexicoMicronesia, Fed. Sts.Middle East & North AfricaMiddle East & North Africa (excluding high income)Middle East & North Africa (IDA & IBRD countries)Middle incomeMoldovaMongoliaMoroccoMozambiqueMyanmarNamibiaNepalNetherlandsNew CaledoniaNew ZealandNicaraguaNigerNigeriaNorth AmericaNorwayOECD membersOmanOther small statesPacific island small statesPakistanPanamaPapua New GuineaParaguayPeruPhilippinesPolandPortugalPost-demographic dividendPre-demographic dividendQatarRomaniaRussian FederationRwandaSamoaSao Tome and PrincipeSaudi ArabiaSenegalSeychellesSierra LeoneSingaporeSlovak RepublicSloveniaSmall statesSolomon IslandsSomaliaSouth AfricaSouth AsiaSouth Asia (IDA & IBRD)SpainSri LankaSt. LuciaSt. Vincent and the GrenadinesSub-Saharan Africa Sub-Saharan Africa (excluding high income)Sub-Saharan Africa (IDA & IBRD countries)SudanSurinameSwazilandSwedenSwitzerlandSyrian Arab RepublicTajikistanTanzaniaThailandTogoTongaTrinidad and TobagoTunisiaTurkeyTurkmenistanUgandaUkraineUnited Arab EmiratesUnited KingdomUnited StatesUpper middle incomeUruguayUzbekistanVanuatuVenezuela, RBVietnamWorldYemen, Rep.ZambiaZimbabwe Timeline:
This timeline shows a graph from 1971 to 2015 of Costa Rica. No data until 1970. Number of actual observations by date: 45.
Source name:
World Development Indicators
Source organization:
World Bank staff estimates based on sources and methods in World Bank's "The Changing Wealth of Nations: Measuring Sustainable Development in the New Millennium" (2011).
Categories, topics:
Economy & Growth, Environment
Last updated:
apr 23, 2017
Indicators value changes by year
At the date of observation
Value
Absolute change
Change from previous value
jan 1, 1971
1.494
+1.494
0.0%
jan 1, 1972
1.163
-0.331
-22.17%
jan 1, 1973
1.18
+0.017
1.49%
jan 1, 1974
1.724
+0.543
46.03%
jan 1, 1975
1.651
-0.073
-4.24%
jan 1, 1976
1.973
+0.323
19.55%
jan 1, 1977
1.326
-0.648
-32.83%
jan 1, 1978
1.823
+0.498
37.54%
jan 1, 1979
1.619
-0.204
-11.21%
jan 1, 1980
1.572
-0.047
-2.9%
jan 1, 1981
1.558
-0.014
-0.91%
jan 1, 1982
2.833
+1.275
81.89%
jan 1, 1983
6.729
+3.896
137.53%
jan 1, 1984
1.362
-5.368
-79.76%
jan 1, 1985
0.693
-0.669
-49.11%
jan 1, 1986
0.418
-0.275
-39.63%
jan 1, 1987
0.362
-0.056
-13.37%
jan 1, 1988
0.344
-0.018
-5.06%
jan 1, 1989
0.334
-0.01
-2.81%
jan 1, 1990
0.293
-0.041
-12.31%
jan 1, 1991
1.803
+1.509
514.63%
jan 1, 1992
1.925
+0.123
6.81%
jan 1, 1993
1.803
-0.122
-6.36%
jan 1, 1994
1.496
-0.306
-17.0%
jan 1, 1995
1.725
+0.229
15.28%
jan 1, 1996
2.187
+0.462
26.76%
jan 1, 1997
1.872
-0.315
-14.41%
jan 1, 1998
1.709
-0.163
-8.71%
jan 1, 1999
1.085
-0.624
-36.52%
jan 1, 2000
0.788
-0.296
-27.32%
jan 1, 2001
0.701
-0.087
-11.1%
jan 1, 2002
0.734
+0.033
4.7%
jan 1, 2003
0.641
-0.093
-12.67%
jan 1, 2004
0.684
+0.044
6.79%
jan 1, 2005
0.661
-0.024
-3.47%
jan 1, 2006
0.683
+0.022
3.36%
jan 1, 2007
0.901
+0.218
31.9%
jan 1, 2008
0.993
+0.092
10.27%
jan 1, 2009
0.954
-0.04
-3.98%
jan 1, 2010
0.861
-0.093
-9.72%
jan 1, 2011
1.172
+0.311
36.17%
jan 1, 2012
0.815
-0.357
-30.47%
jan 1, 2013
0.842
+0.026
3.24%
jan 1, 2014
0.865
+0.024
2.85%
jan 1, 2015
1.175
+0.309
35.73%
Ranking of countries by current statistics by years


Comments: