29
/
en
AIzaSyAYiBZKx7MnpbEhh9jyipgxe19OcubqV5w
April 1, 2024
77810
Bangladesh
BGD
true
2
1
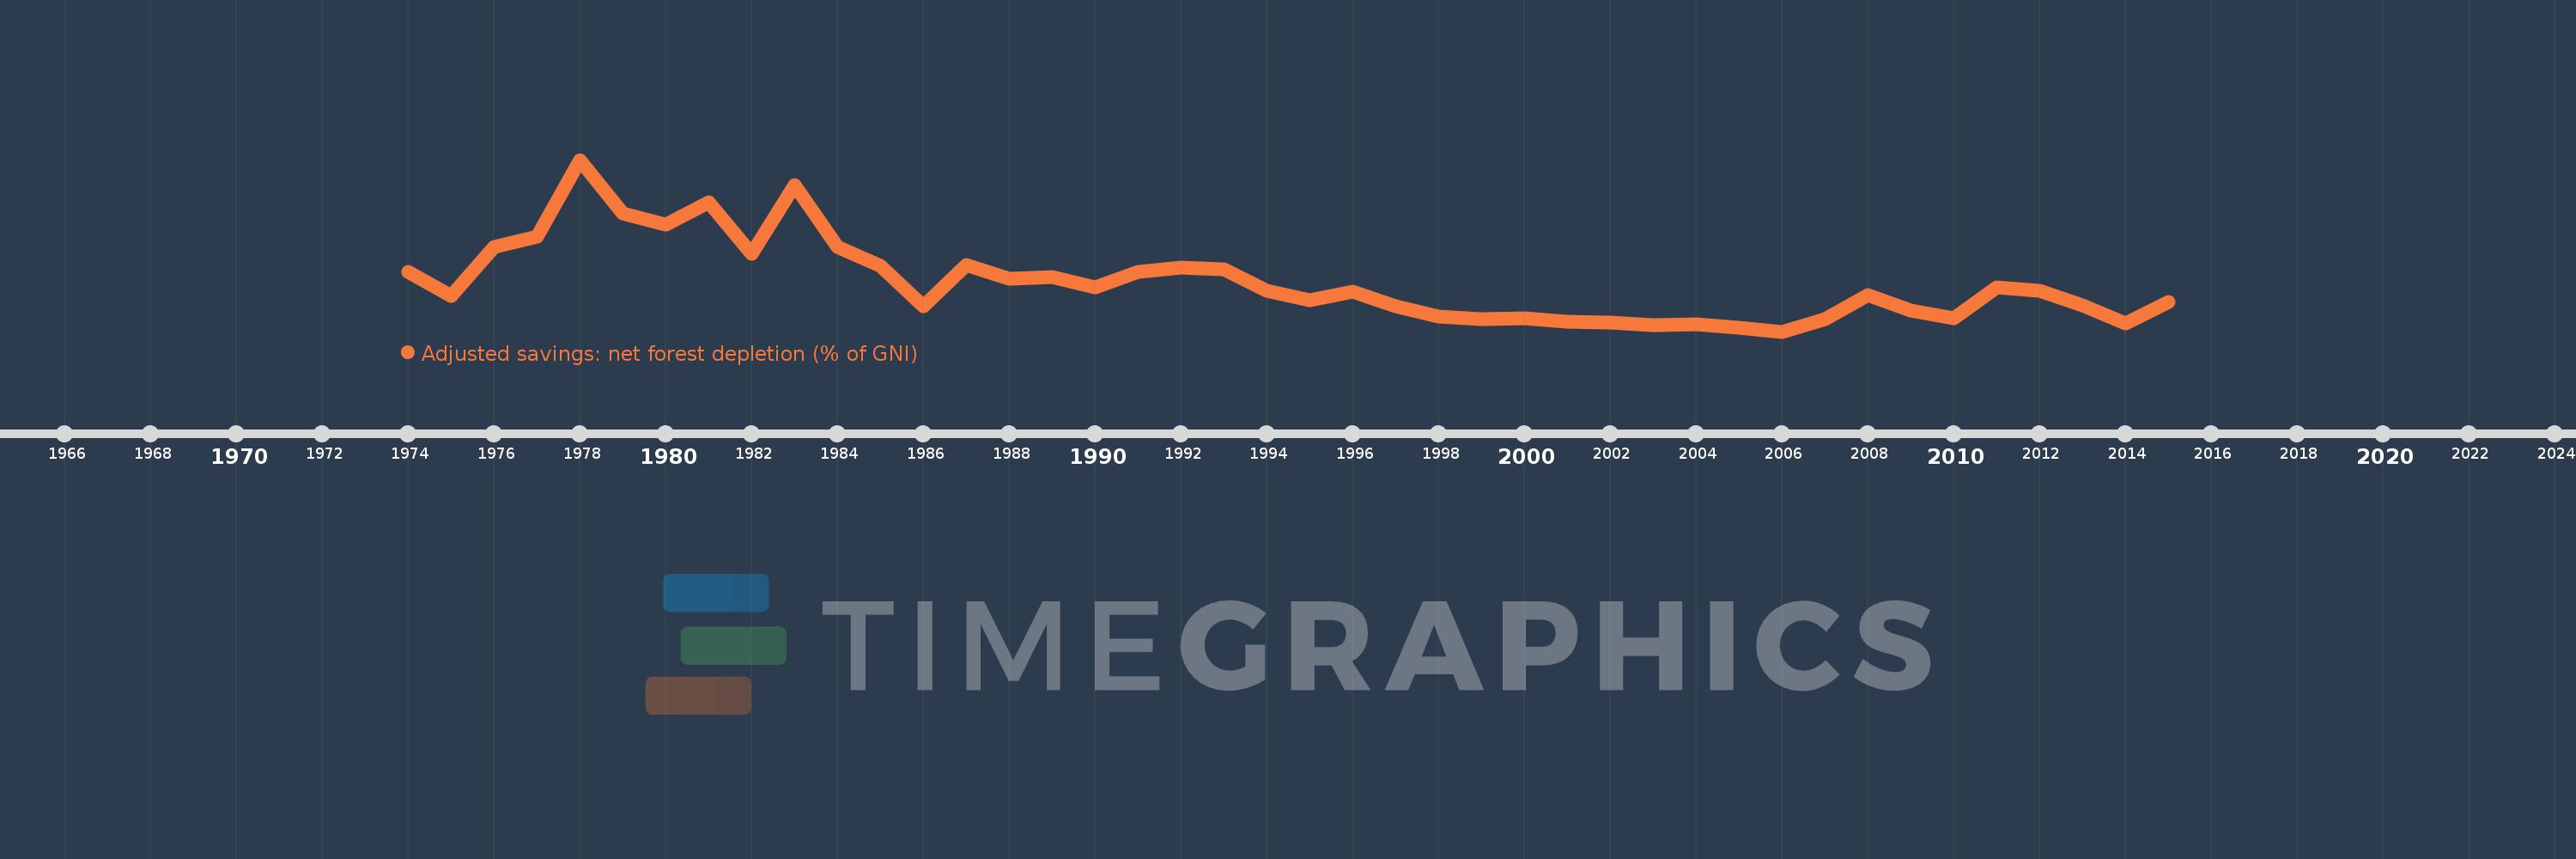
Adjusted savings: net forest depletion (% of GNI)
2015,2014,2013,2012,2011,2010,2009,2008,2007,2006,2005,2004,2003,2002,2001,2000,1999,1998,1997,1996,1995,1994,1993,1992,1991,1990,1989,1988,1987,1986,1985,1984,1983,1982,1981,1980,1979,1978,1977,1976,1975,1974
This statistics in other country:
AfghanistanAlbaniaAlgeriaAngolaArab WorldArgentinaArmeniaAustraliaAustriaAzerbaijanBahamas, TheBahrainBangladeshBarbadosBelarusBelgiumBelizeBeninBhutanBoliviaBotswanaBrazilBrunei DarussalamBulgariaBurkina FasoBurundiCabo VerdeCambodiaCameroonCanadaCaribbean small statesCentral African RepublicCentral Europe and the BalticsChadChileChinaColombiaComorosCongo, Dem. Rep.Congo, Rep.Costa RicaCote d'IvoireCroatiaCubaCyprusCzech RepublicDenmarkDjiboutiDominicaDominican RepublicEarly-demographic dividendEast Asia & PacificEast Asia & Pacific (excluding high income)East Asia & Pacific (IDA & IBRD countries)EcuadorEgypt, Arab Rep.El SalvadorEquatorial GuineaEritreaEstoniaEthiopiaEuro areaEurope & Central AsiaEurope & Central Asia (excluding high income)Europe & Central Asia (IDA & IBRD countries)European UnionFijiFinlandFragile and conflict affected situationsFranceFrench PolynesiaGabonGambia, TheGeorgiaGermanyGhanaGreeceGuatemalaGuineaGuinea-BissauGuyanaHaitiHeavily indebted poor countries (HIPC)High incomeHondurasHong Kong SAR, ChinaHungaryIBRD onlyIcelandIDA & IBRD totalIDA blendIDA onlyIDA totalIndiaIndonesiaIran, Islamic Rep.IraqIrelandIsraelItalyJamaicaJapanJordanKazakhstanKenyaKiribatiKorea, Rep.KuwaitKyrgyz RepublicLao PDRLate-demographic dividendLatin America & Caribbean Latin America & Caribbean (excluding high income)Latin America & the Caribbean (IDA & IBRD countries)LatviaLeast developed countries: UN classificationLebanonLesothoLiberiaLibyaLithuaniaLow & middle incomeLow incomeLower middle incomeLuxembourgMacedonia, FYRMadagascarMalawiMalaysiaMaldivesMaliMauritaniaMauritiusMexicoMicronesia, Fed. Sts.Middle East & North AfricaMiddle East & North Africa (excluding high income)Middle East & North Africa (IDA & IBRD countries)Middle incomeMoldovaMongoliaMoroccoMozambiqueMyanmarNamibiaNepalNetherlandsNew CaledoniaNew ZealandNicaraguaNigerNigeriaNorth AmericaNorwayOECD membersOmanOther small statesPacific island small statesPakistanPanamaPapua New GuineaParaguayPeruPhilippinesPolandPortugalPost-demographic dividendPre-demographic dividendQatarRomaniaRussian FederationRwandaSamoaSao Tome and PrincipeSaudi ArabiaSenegalSeychellesSierra LeoneSingaporeSlovak RepublicSloveniaSmall statesSolomon IslandsSomaliaSouth AfricaSouth AsiaSouth Asia (IDA & IBRD)SpainSri LankaSt. LuciaSt. Vincent and the GrenadinesSub-Saharan Africa Sub-Saharan Africa (excluding high income)Sub-Saharan Africa (IDA & IBRD countries)SudanSurinameSwazilandSwedenSwitzerlandSyrian Arab RepublicTajikistanTanzaniaThailandTogoTongaTrinidad and TobagoTunisiaTurkeyTurkmenistanUgandaUkraineUnited Arab EmiratesUnited KingdomUnited StatesUpper middle incomeUruguayUzbekistanVanuatuVenezuela, RBVietnamWorldYemen, Rep.ZambiaZimbabwe Timeline:
This timeline shows a graph from 1974 to 2015 of Bangladesh. No data until 1973. Number of actual observations by date: 42.
Source name:
World Development Indicators
Source organization:
World Bank staff estimates based on sources and methods in World Bank's "The Changing Wealth of Nations: Measuring Sustainable Development in the New Millennium" (2011).
Categories, topics:
Economy & Growth, Environment
Last updated:
apr 23, 2017
Indicators value changes by year
At the date of observation
Value
Absolute change
Change from previous value
jan 1, 1974
1.953
+1.953
0.0%
jan 1, 1975
1.477
-0.476
-24.35%
jan 1, 1976
2.464
+0.986
66.77%
jan 1, 1977
2.683
+0.219
8.9%
jan 1, 1978
4.241
+1.558
58.09%
jan 1, 1979
3.148
-1.093
-25.77%
jan 1, 1980
2.923
-0.225
-7.16%
jan 1, 1981
3.369
+0.446
15.25%
jan 1, 1982
2.32
-1.049
-31.15%
jan 1, 1983
3.731
+1.412
60.87%
jan 1, 1984
2.458
-1.274
-34.13%
jan 1, 1985
2.085
-0.373
-15.17%
jan 1, 1986
1.266
-0.819
-39.29%
jan 1, 1987
2.098
+0.832
65.71%
jan 1, 1988
1.81
-0.287
-13.7%
jan 1, 1989
1.858
+0.048
2.64%
jan 1, 1990
1.638
-0.22
-11.86%
jan 1, 1991
1.964
+0.326
19.9%
jan 1, 1992
2.047
+0.083
4.22%
jan 1, 1993
2.01
-0.036
-1.77%
jan 1, 1994
1.574
-0.437
-21.73%
jan 1, 1995
1.382
-0.192
-12.19%
jan 1, 1996
1.552
+0.171
12.36%
jan 1, 1997
1.264
-0.288
-18.57%
jan 1, 1998
1.046
-0.218
-17.24%
jan 1, 1999
1.001
-0.045
-4.28%
jan 1, 2000
1.012
+0.011
1.09%
jan 1, 2001
0.942
-0.07
-6.9%
jan 1, 2002
0.926
-0.016
-1.69%
jan 1, 2003
0.872
-0.055
-5.92%
jan 1, 2004
0.885
+0.014
1.58%
jan 1, 2005
0.826
-0.06
-6.75%
jan 1, 2006
0.743
-0.083
-10.04%
jan 1, 2007
0.996
+0.254
34.16%
jan 1, 2008
1.491
+0.495
49.69%
jan 1, 2009
1.169
-0.322
-21.62%
jan 1, 2010
1.01
-0.159
-13.64%
jan 1, 2011
1.646
+0.637
63.06%
jan 1, 2012
1.568
-0.079
-4.78%
jan 1, 2013
1.28
-0.288
-18.38%
jan 1, 2014
0.913
-0.366
-28.63%
jan 1, 2015
1.345
+0.432
47.26%
Ranking of countries by current statistics by years


Comments: