29
/
en
AIzaSyAYiBZKx7MnpbEhh9jyipgxe19OcubqV5w
April 1, 2024
37125
IDA & IBRD total
IBT
false
2
1
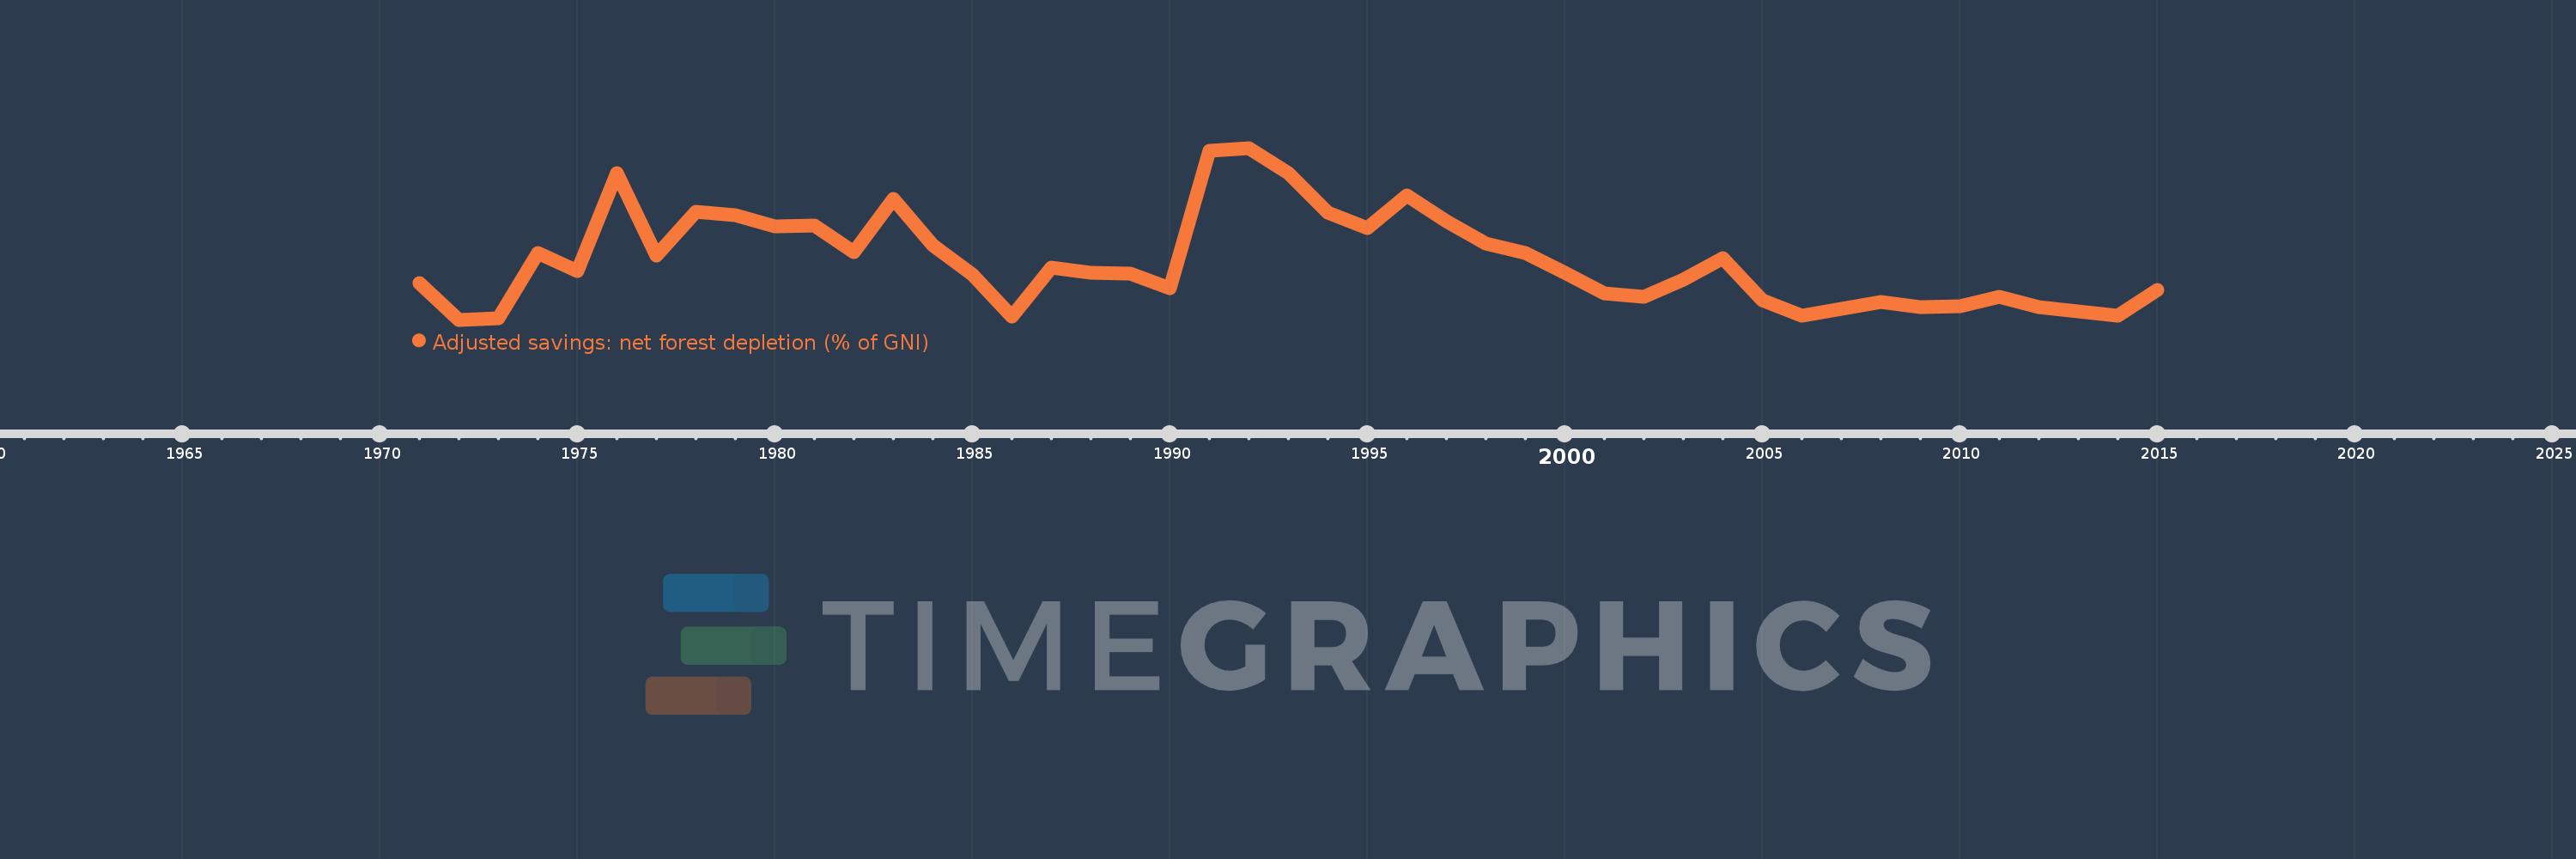
Adjusted savings: net forest depletion (% of GNI)
2015,2014,2013,2012,2011,2010,2009,2008,2007,2006,2005,2004,2003,2002,2001,2000,1999,1998,1997,1996,1995,1994,1993,1992,1991,1990,1989,1988,1987,1986,1985,1984,1983,1982,1981,1980,1979,1978,1977,1976,1975,1974,1973,1972,1971
This statistics in other country:
AfghanistanAlbaniaAlgeriaAngolaArab WorldArgentinaArmeniaAustraliaAustriaAzerbaijanBahamas, TheBahrainBangladeshBarbadosBelarusBelgiumBelizeBeninBhutanBoliviaBotswanaBrazilBrunei DarussalamBulgariaBurkina FasoBurundiCabo VerdeCambodiaCameroonCanadaCaribbean small statesCentral African RepublicCentral Europe and the BalticsChadChileChinaColombiaComorosCongo, Dem. Rep.Congo, Rep.Costa RicaCote d'IvoireCroatiaCubaCyprusCzech RepublicDenmarkDjiboutiDominicaDominican RepublicEarly-demographic dividendEast Asia & PacificEast Asia & Pacific (excluding high income)East Asia & Pacific (IDA & IBRD countries)EcuadorEgypt, Arab Rep.El SalvadorEquatorial GuineaEritreaEstoniaEthiopiaEuro areaEurope & Central AsiaEurope & Central Asia (excluding high income)Europe & Central Asia (IDA & IBRD countries)European UnionFijiFinlandFragile and conflict affected situationsFranceFrench PolynesiaGabonGambia, TheGeorgiaGermanyGhanaGreeceGuatemalaGuineaGuinea-BissauGuyanaHaitiHeavily indebted poor countries (HIPC)High incomeHondurasHong Kong SAR, ChinaHungaryIBRD onlyIcelandIDA & IBRD totalIDA blendIDA onlyIDA totalIndiaIndonesiaIran, Islamic Rep.IraqIrelandIsraelItalyJamaicaJapanJordanKazakhstanKenyaKiribatiKorea, Rep.KuwaitKyrgyz RepublicLao PDRLate-demographic dividendLatin America & Caribbean Latin America & Caribbean (excluding high income)Latin America & the Caribbean (IDA & IBRD countries)LatviaLeast developed countries: UN classificationLebanonLesothoLiberiaLibyaLithuaniaLow & middle incomeLow incomeLower middle incomeLuxembourgMacedonia, FYRMadagascarMalawiMalaysiaMaldivesMaliMauritaniaMauritiusMexicoMicronesia, Fed. Sts.Middle East & North AfricaMiddle East & North Africa (excluding high income)Middle East & North Africa (IDA & IBRD countries)Middle incomeMoldovaMongoliaMoroccoMozambiqueMyanmarNamibiaNepalNetherlandsNew CaledoniaNew ZealandNicaraguaNigerNigeriaNorth AmericaNorwayOECD membersOmanOther small statesPacific island small statesPakistanPanamaPapua New GuineaParaguayPeruPhilippinesPolandPortugalPost-demographic dividendPre-demographic dividendQatarRomaniaRussian FederationRwandaSamoaSao Tome and PrincipeSaudi ArabiaSenegalSeychellesSierra LeoneSingaporeSlovak RepublicSloveniaSmall statesSolomon IslandsSomaliaSouth AfricaSouth AsiaSouth Asia (IDA & IBRD)SpainSri LankaSt. LuciaSt. Vincent and the GrenadinesSub-Saharan Africa Sub-Saharan Africa (excluding high income)Sub-Saharan Africa (IDA & IBRD countries)SudanSurinameSwazilandSwedenSwitzerlandSyrian Arab RepublicTajikistanTanzaniaThailandTogoTongaTrinidad and TobagoTunisiaTurkeyTurkmenistanUgandaUkraineUnited Arab EmiratesUnited KingdomUnited StatesUpper middle incomeUruguayUzbekistanVanuatuVenezuela, RBVietnamWorldYemen, Rep.ZambiaZimbabwe Timeline:
This timeline shows a graph from 1971 to 2015 of IDA & IBRD total. No data until 1970. Number of actual observations by date: 45.
Source name:
World Development Indicators
Source organization:
World Bank staff estimates based on sources and methods in World Bank's "The Changing Wealth of Nations: Measuring Sustainable Development in the New Millennium" (2011).
Categories, topics:
Economy & Growth, Environment
Last updated:
apr 23, 2017
Indicators value changes by year
At the date of observation
Value
Absolute change
Change from previous value
jan 1, 1971
0.422
+0.422
0.0%
jan 1, 1972
0.302
-0.12
-28.54%
jan 1, 1973
0.308
+0.006
2.14%
jan 1, 1974
0.52
+0.212
68.82%
jan 1, 1975
0.461
-0.059
-11.4%
jan 1, 1976
0.782
+0.321
69.6%
jan 1, 1977
0.512
-0.27
-34.5%
jan 1, 1978
0.655
+0.143
27.92%
jan 1, 1979
0.644
-0.011
-1.63%
jan 1, 1980
0.608
-0.037
-5.68%
jan 1, 1981
0.611
+0.003
0.52%
jan 1, 1982
0.522
-0.089
-14.62%
jan 1, 1983
0.696
+0.175
33.47%
jan 1, 1984
0.546
-0.15
-21.59%
jan 1, 1985
0.45
-0.096
-17.65%
jan 1, 1986
0.311
-0.138
-30.79%
jan 1, 1987
0.471
+0.16
51.35%
jan 1, 1988
0.455
-0.016
-3.41%
jan 1, 1989
0.453
-0.002
-0.42%
jan 1, 1990
0.405
-0.048
-10.65%
jan 1, 1991
0.855
+0.45
111.19%
jan 1, 1992
0.863
+0.008
0.95%
jan 1, 1993
0.781
-0.082
-9.52%
jan 1, 1994
0.651
-0.129
-16.58%
jan 1, 1995
0.601
-0.05
-7.71%
jan 1, 1996
0.709
+0.108
18.04%
jan 1, 1997
0.624
-0.085
-11.96%
jan 1, 1998
0.552
-0.072
-11.56%
jan 1, 1999
0.521
-0.031
-5.61%
jan 1, 2000
0.456
-0.066
-12.59%
jan 1, 2001
0.388
-0.068
-14.88%
jan 1, 2002
0.377
-0.011
-2.85%
jan 1, 2003
0.434
+0.057
15.12%
jan 1, 2004
0.504
+0.071
16.27%
jan 1, 2005
0.367
-0.137
-27.15%
jan 1, 2006
0.316
-0.051
-13.98%
jan 1, 2007
0.337
+0.021
6.77%
jan 1, 2008
0.359
+0.022
6.52%
jan 1, 2009
0.343
-0.016
-4.44%
jan 1, 2010
0.346
+0.003
0.75%
jan 1, 2011
0.378
+0.032
9.21%
jan 1, 2012
0.344
-0.034
-9.06%
jan 1, 2013
0.329
-0.014
-4.17%
jan 1, 2014
0.314
-0.015
-4.53%
jan 1, 2015
0.4
+0.086
27.27%
Ranking of countries by current statistics by years


Comments: