29
/
en
AIzaSyAYiBZKx7MnpbEhh9jyipgxe19OcubqV5w
April 1, 2024
124415
Egypt, Arab Rep.
EGY
true
2
1
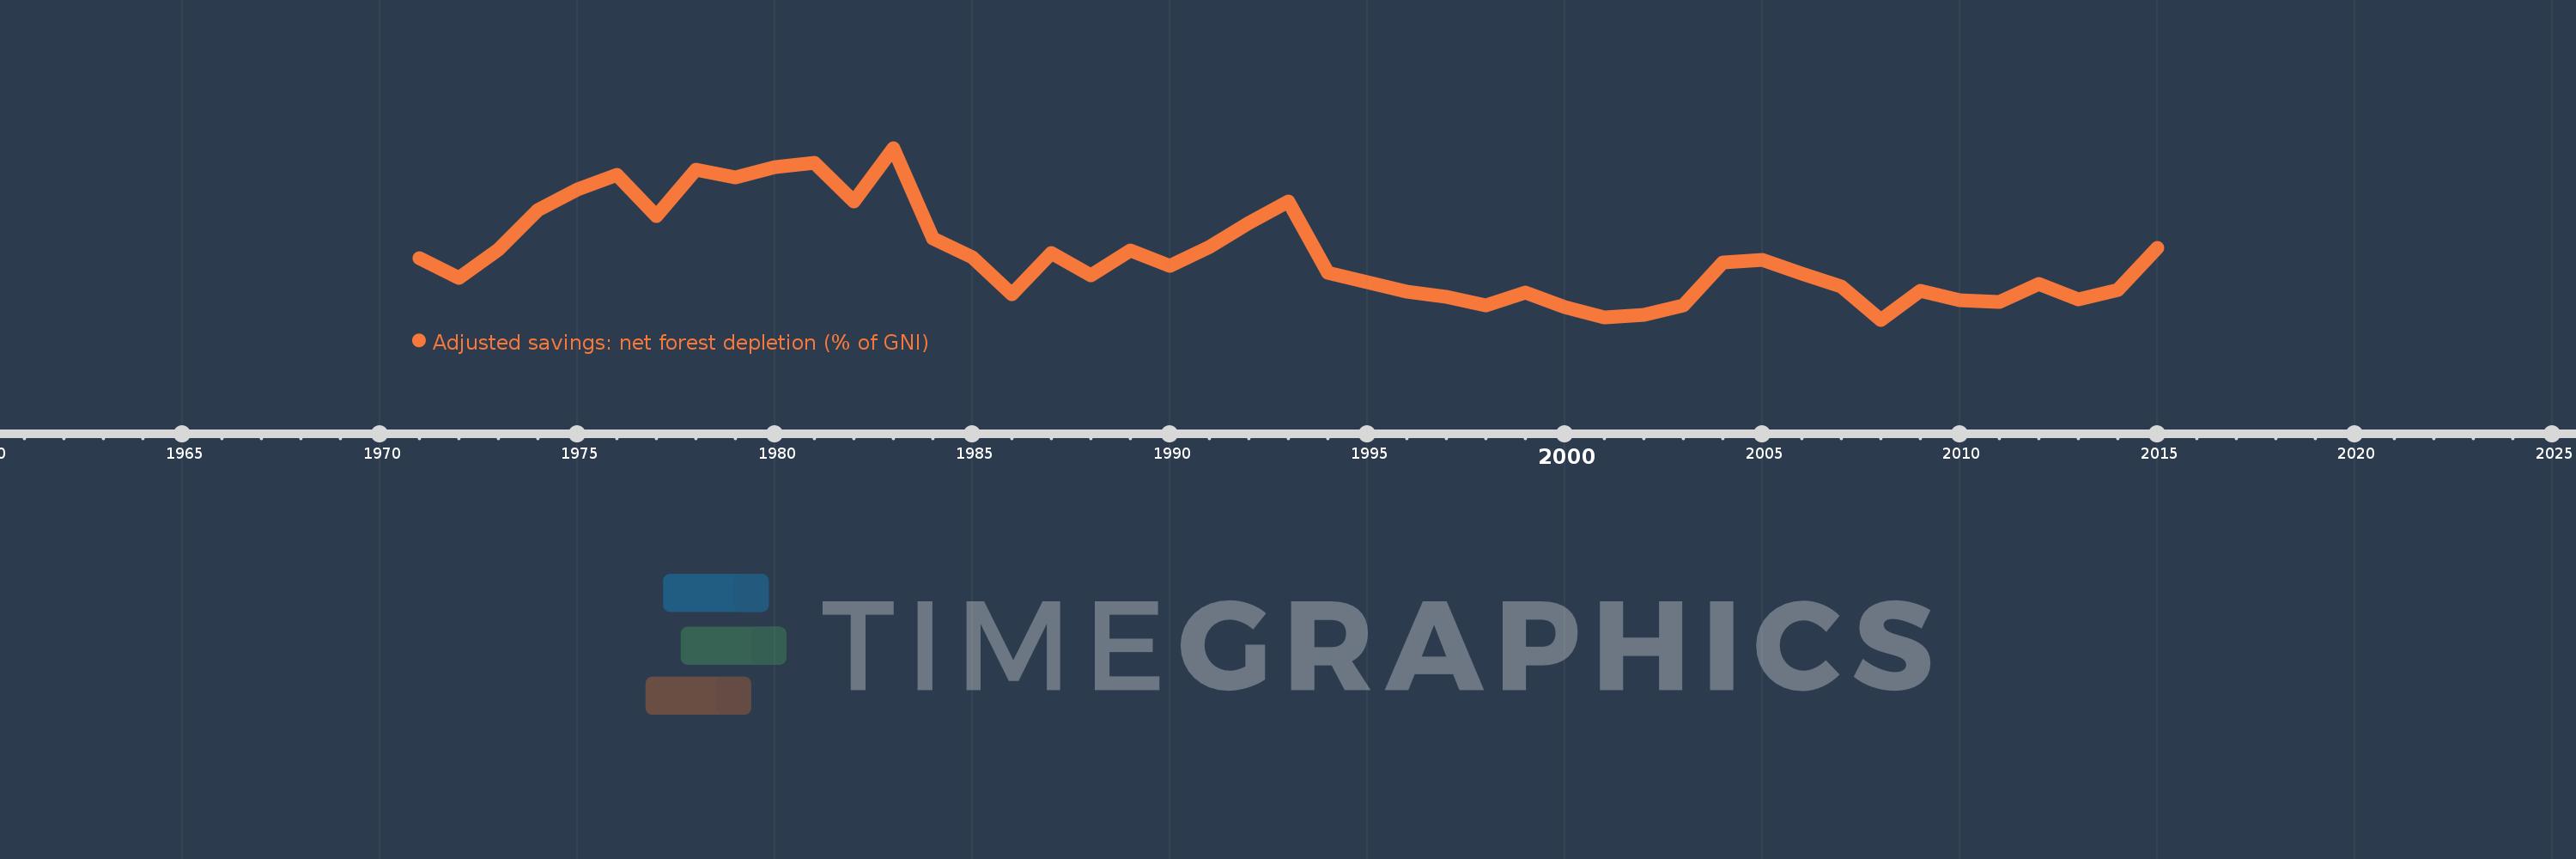
Adjusted savings: net forest depletion (% of GNI)
2015,2014,2013,2012,2011,2010,2009,2008,2007,2006,2005,2004,2003,2002,2001,2000,1999,1998,1997,1996,1995,1994,1993,1992,1991,1990,1989,1988,1987,1986,1985,1984,1983,1982,1981,1980,1979,1978,1977,1976,1975,1974,1973,1972,1971
This statistics in other country:
AfghanistanAlbaniaAlgeriaAngolaArab WorldArgentinaArmeniaAustraliaAustriaAzerbaijanBahamas, TheBahrainBangladeshBarbadosBelarusBelgiumBelizeBeninBhutanBoliviaBotswanaBrazilBrunei DarussalamBulgariaBurkina FasoBurundiCabo VerdeCambodiaCameroonCanadaCaribbean small statesCentral African RepublicCentral Europe and the BalticsChadChileChinaColombiaComorosCongo, Dem. Rep.Congo, Rep.Costa RicaCote d'IvoireCroatiaCubaCyprusCzech RepublicDenmarkDjiboutiDominicaDominican RepublicEarly-demographic dividendEast Asia & PacificEast Asia & Pacific (excluding high income)East Asia & Pacific (IDA & IBRD countries)EcuadorEgypt, Arab Rep.El SalvadorEquatorial GuineaEritreaEstoniaEthiopiaEuro areaEurope & Central AsiaEurope & Central Asia (excluding high income)Europe & Central Asia (IDA & IBRD countries)European UnionFijiFinlandFragile and conflict affected situationsFranceFrench PolynesiaGabonGambia, TheGeorgiaGermanyGhanaGreeceGuatemalaGuineaGuinea-BissauGuyanaHaitiHeavily indebted poor countries (HIPC)High incomeHondurasHong Kong SAR, ChinaHungaryIBRD onlyIcelandIDA & IBRD totalIDA blendIDA onlyIDA totalIndiaIndonesiaIran, Islamic Rep.IraqIrelandIsraelItalyJamaicaJapanJordanKazakhstanKenyaKiribatiKorea, Rep.KuwaitKyrgyz RepublicLao PDRLate-demographic dividendLatin America & Caribbean Latin America & Caribbean (excluding high income)Latin America & the Caribbean (IDA & IBRD countries)LatviaLeast developed countries: UN classificationLebanonLesothoLiberiaLibyaLithuaniaLow & middle incomeLow incomeLower middle incomeLuxembourgMacedonia, FYRMadagascarMalawiMalaysiaMaldivesMaliMauritaniaMauritiusMexicoMicronesia, Fed. Sts.Middle East & North AfricaMiddle East & North Africa (excluding high income)Middle East & North Africa (IDA & IBRD countries)Middle incomeMoldovaMongoliaMoroccoMozambiqueMyanmarNamibiaNepalNetherlandsNew CaledoniaNew ZealandNicaraguaNigerNigeriaNorth AmericaNorwayOECD membersOmanOther small statesPacific island small statesPakistanPanamaPapua New GuineaParaguayPeruPhilippinesPolandPortugalPost-demographic dividendPre-demographic dividendQatarRomaniaRussian FederationRwandaSamoaSao Tome and PrincipeSaudi ArabiaSenegalSeychellesSierra LeoneSingaporeSlovak RepublicSloveniaSmall statesSolomon IslandsSomaliaSouth AfricaSouth AsiaSouth Asia (IDA & IBRD)SpainSri LankaSt. LuciaSt. Vincent and the GrenadinesSub-Saharan Africa Sub-Saharan Africa (excluding high income)Sub-Saharan Africa (IDA & IBRD countries)SudanSurinameSwazilandSwedenSwitzerlandSyrian Arab RepublicTajikistanTanzaniaThailandTogoTongaTrinidad and TobagoTunisiaTurkeyTurkmenistanUgandaUkraineUnited Arab EmiratesUnited KingdomUnited StatesUpper middle incomeUruguayUzbekistanVanuatuVenezuela, RBVietnamWorldYemen, Rep.ZambiaZimbabwe Timeline:
This timeline shows a graph from 1971 to 2015 of Egypt, Arab Rep.. No data until 1970. Number of actual observations by date: 45.
Source name:
World Development Indicators
Source organization:
World Bank staff estimates based on sources and methods in World Bank's "The Changing Wealth of Nations: Measuring Sustainable Development in the New Millennium" (2011).
Categories, topics:
Economy & Growth, Environment
Last updated:
apr 23, 2017
Indicators value changes by year
At the date of observation
Value
Absolute change
Change from previous value
jan 1, 1971
0.738
+0.738
0.0%
jan 1, 1972
0.592
-0.147
-19.86%
jan 1, 1973
0.797
+0.205
34.63%
jan 1, 1974
1.086
+0.29
36.35%
jan 1, 1975
1.233
+0.147
13.51%
jan 1, 1976
1.341
+0.108
8.79%
jan 1, 1977
1.039
-0.302
-22.55%
jan 1, 1978
1.378
+0.339
32.63%
jan 1, 1979
1.319
-0.059
-4.29%
jan 1, 1980
1.392
+0.073
5.55%
jan 1, 1981
1.425
+0.033
2.38%
jan 1, 1982
1.149
-0.276
-19.35%
jan 1, 1983
1.532
+0.383
33.31%
jan 1, 1984
0.881
-0.651
-42.47%
jan 1, 1985
0.742
-0.139
-15.76%
jan 1, 1986
0.48
-0.262
-35.31%
jan 1, 1987
0.776
+0.296
61.59%
jan 1, 1988
0.612
-0.164
-21.17%
jan 1, 1989
0.796
+0.184
30.12%
jan 1, 1990
0.684
-0.112
-14.02%
jan 1, 1991
0.819
+0.134
19.6%
jan 1, 1992
0.994
+0.176
21.47%
jan 1, 1993
1.147
+0.153
15.36%
jan 1, 1994
0.631
-0.516
-44.98%
jan 1, 1995
0.563
-0.068
-10.82%
jan 1, 1996
0.494
-0.069
-12.23%
jan 1, 1997
0.459
-0.035
-7.1%
jan 1, 1998
0.399
-0.06
-13.01%
jan 1, 1999
0.487
+0.088
22.11%
jan 1, 2000
0.387
-0.101
-20.63%
jan 1, 2001
0.308
-0.079
-20.38%
jan 1, 2002
0.326
+0.018
5.76%
jan 1, 2003
0.396
+0.071
21.69%
jan 1, 2004
0.708
+0.311
78.54%
jan 1, 2005
0.727
+0.019
2.67%
jan 1, 2006
0.627
-0.1
-13.69%
jan 1, 2007
0.534
-0.093
-14.9%
jan 1, 2008
0.293
-0.241
-45.12%
jan 1, 2009
0.501
+0.208
71.14%
jan 1, 2010
0.431
-0.071
-14.08%
jan 1, 2011
0.42
-0.011
-2.53%
jan 1, 2012
0.55
+0.13
31.07%
jan 1, 2013
0.441
-0.109
-19.81%
jan 1, 2014
0.511
+0.07
15.88%
jan 1, 2015
0.811
+0.299
58.56%
Ranking of countries by current statistics by years


Comments: