29
/
en
AIzaSyAYiBZKx7MnpbEhh9jyipgxe19OcubqV5w
April 1, 2024
177294
Lesotho
LSO
true
2
1
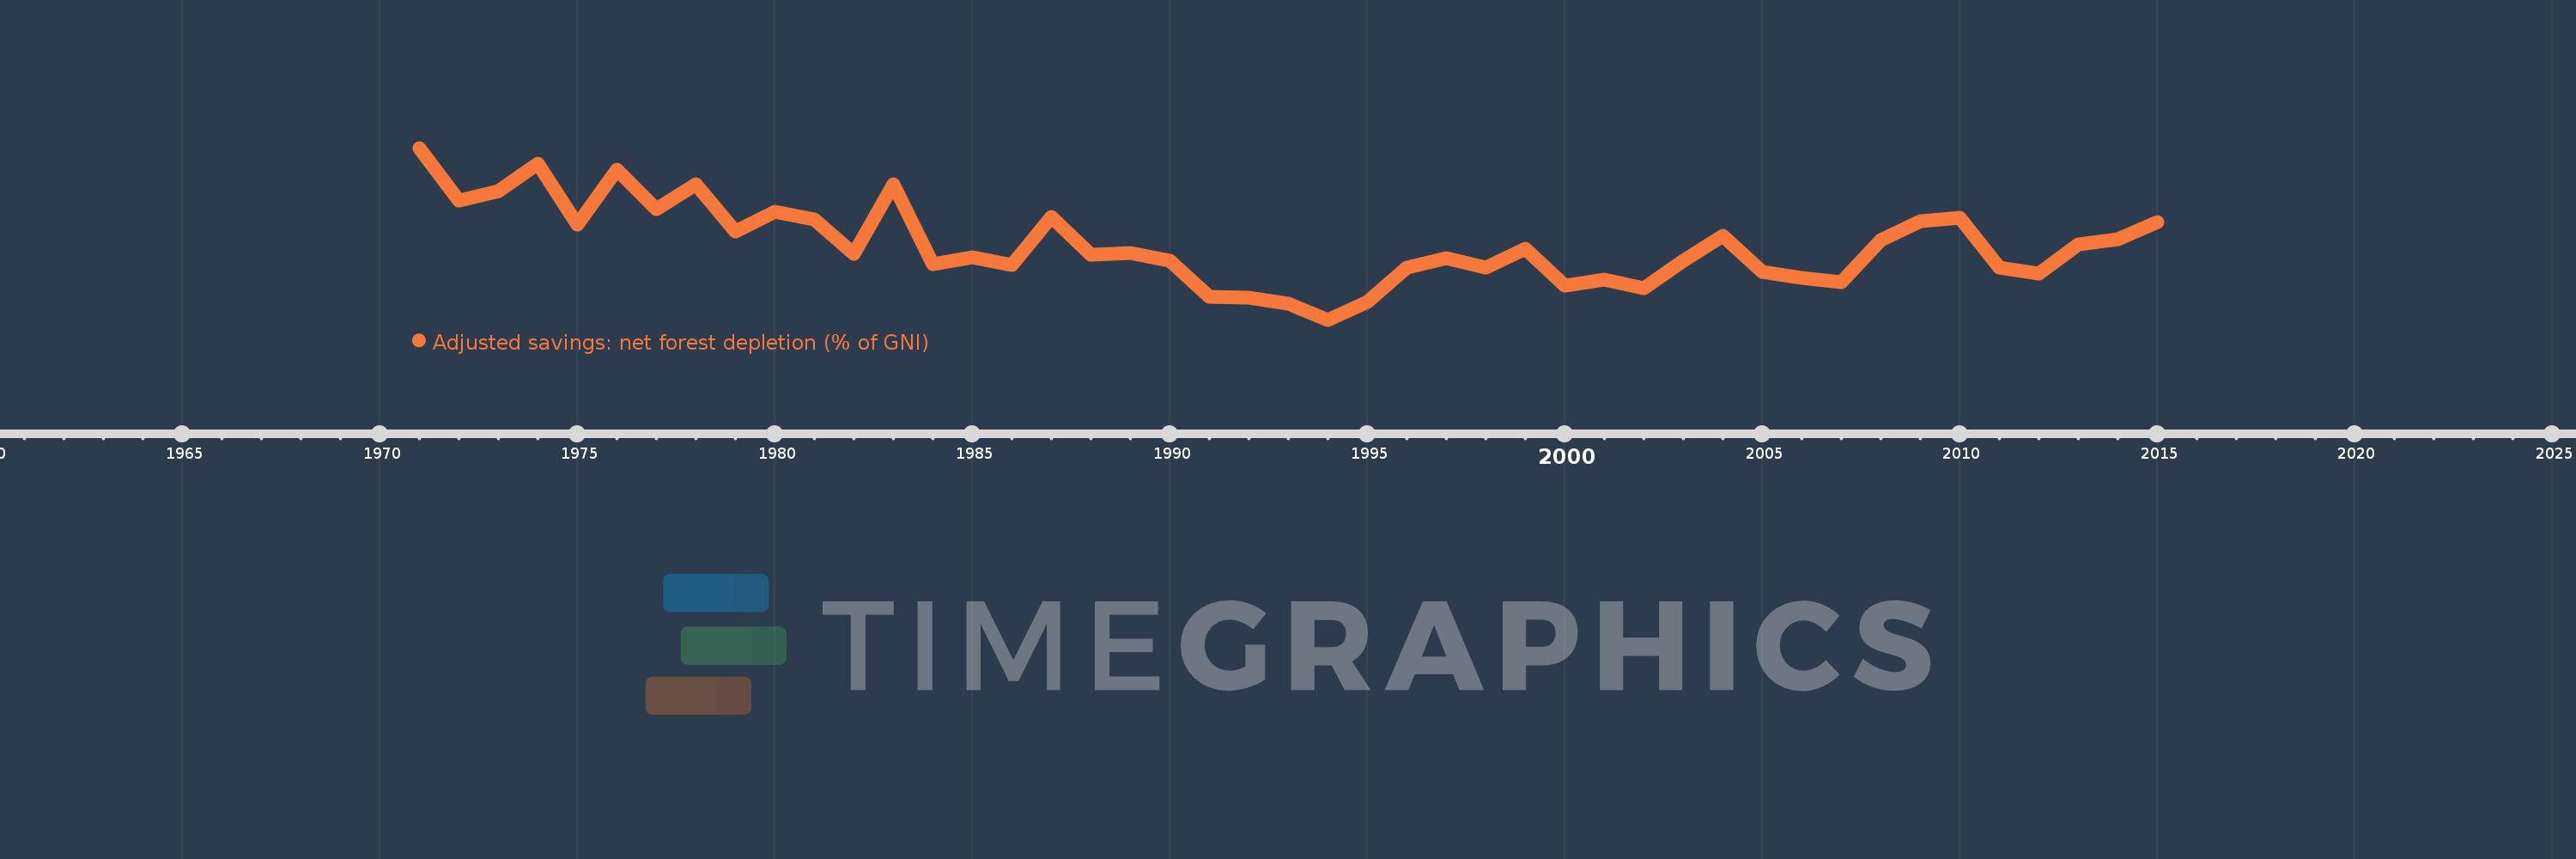
Adjusted savings: net forest depletion (% of GNI)
2015,2014,2013,2012,2011,2010,2009,2008,2007,2006,2005,2004,2003,2002,2001,2000,1999,1998,1997,1996,1995,1994,1993,1992,1991,1990,1989,1988,1987,1986,1985,1984,1983,1982,1981,1980,1979,1978,1977,1976,1975,1974,1973,1972,1971
This statistics in other country:
AfghanistanAlbaniaAlgeriaAngolaArab WorldArgentinaArmeniaAustraliaAustriaAzerbaijanBahamas, TheBahrainBangladeshBarbadosBelarusBelgiumBelizeBeninBhutanBoliviaBotswanaBrazilBrunei DarussalamBulgariaBurkina FasoBurundiCabo VerdeCambodiaCameroonCanadaCaribbean small statesCentral African RepublicCentral Europe and the BalticsChadChileChinaColombiaComorosCongo, Dem. Rep.Congo, Rep.Costa RicaCote d'IvoireCroatiaCubaCyprusCzech RepublicDenmarkDjiboutiDominicaDominican RepublicEarly-demographic dividendEast Asia & PacificEast Asia & Pacific (excluding high income)East Asia & Pacific (IDA & IBRD countries)EcuadorEgypt, Arab Rep.El SalvadorEquatorial GuineaEritreaEstoniaEthiopiaEuro areaEurope & Central AsiaEurope & Central Asia (excluding high income)Europe & Central Asia (IDA & IBRD countries)European UnionFijiFinlandFragile and conflict affected situationsFranceFrench PolynesiaGabonGambia, TheGeorgiaGermanyGhanaGreeceGuatemalaGuineaGuinea-BissauGuyanaHaitiHeavily indebted poor countries (HIPC)High incomeHondurasHong Kong SAR, ChinaHungaryIBRD onlyIcelandIDA & IBRD totalIDA blendIDA onlyIDA totalIndiaIndonesiaIran, Islamic Rep.IraqIrelandIsraelItalyJamaicaJapanJordanKazakhstanKenyaKiribatiKorea, Rep.KuwaitKyrgyz RepublicLao PDRLate-demographic dividendLatin America & Caribbean Latin America & Caribbean (excluding high income)Latin America & the Caribbean (IDA & IBRD countries)LatviaLeast developed countries: UN classificationLebanonLesothoLiberiaLibyaLithuaniaLow & middle incomeLow incomeLower middle incomeLuxembourgMacedonia, FYRMadagascarMalawiMalaysiaMaldivesMaliMauritaniaMauritiusMexicoMicronesia, Fed. Sts.Middle East & North AfricaMiddle East & North Africa (excluding high income)Middle East & North Africa (IDA & IBRD countries)Middle incomeMoldovaMongoliaMoroccoMozambiqueMyanmarNamibiaNepalNetherlandsNew CaledoniaNew ZealandNicaraguaNigerNigeriaNorth AmericaNorwayOECD membersOmanOther small statesPacific island small statesPakistanPanamaPapua New GuineaParaguayPeruPhilippinesPolandPortugalPost-demographic dividendPre-demographic dividendQatarRomaniaRussian FederationRwandaSamoaSao Tome and PrincipeSaudi ArabiaSenegalSeychellesSierra LeoneSingaporeSlovak RepublicSloveniaSmall statesSolomon IslandsSomaliaSouth AfricaSouth AsiaSouth Asia (IDA & IBRD)SpainSri LankaSt. LuciaSt. Vincent and the GrenadinesSub-Saharan Africa Sub-Saharan Africa (excluding high income)Sub-Saharan Africa (IDA & IBRD countries)SudanSurinameSwazilandSwedenSwitzerlandSyrian Arab RepublicTajikistanTanzaniaThailandTogoTongaTrinidad and TobagoTunisiaTurkeyTurkmenistanUgandaUkraineUnited Arab EmiratesUnited KingdomUnited StatesUpper middle incomeUruguayUzbekistanVanuatuVenezuela, RBVietnamWorldYemen, Rep.ZambiaZimbabwe Timeline:
This timeline shows a graph from 1971 to 2015 of Lesotho. No data until 1970. Number of actual observations by date: 45.
Source name:
World Development Indicators
Source organization:
World Bank staff estimates based on sources and methods in World Bank's "The Changing Wealth of Nations: Measuring Sustainable Development in the New Millennium" (2011).
Categories, topics:
Economy & Growth, Environment
Last updated:
apr 23, 2017
Indicators value changes by year
At the date of observation
Value
Absolute change
Change from previous value
jan 1, 1971
6.809
+6.809
0.0%
jan 1, 1972
5.262
-1.548
-22.73%
jan 1, 1973
5.535
+0.273
5.18%
jan 1, 1974
6.338
+0.803
14.51%
jan 1, 1975
4.56
-1.777
-28.05%
jan 1, 1976
6.166
+1.606
35.22%
jan 1, 1977
5.013
-1.154
-18.71%
jan 1, 1978
5.743
+0.73
14.56%
jan 1, 1979
4.363
-1.38
-24.03%
jan 1, 1980
4.939
+0.577
13.22%
jan 1, 1981
4.722
-0.217
-4.39%
jan 1, 1982
3.705
-1.018
-21.55%
jan 1, 1983
5.748
+2.043
55.15%
jan 1, 1984
3.414
-2.334
-40.61%
jan 1, 1985
3.616
+0.202
5.93%
jan 1, 1986
3.393
-0.223
-6.17%
jan 1, 1987
4.789
+1.396
41.14%
jan 1, 1988
3.681
-1.108
-23.14%
jan 1, 1989
3.733
+0.052
1.41%
jan 1, 1990
3.515
-0.218
-5.85%
jan 1, 1991
2.45
-1.064
-30.28%
jan 1, 1992
2.441
-0.009
-0.37%
jan 1, 1993
2.257
-0.184
-7.53%
jan 1, 1994
1.79
-0.468
-20.72%
jan 1, 1995
2.303
+0.513
28.68%
jan 1, 1996
3.316
+1.013
43.97%
jan 1, 1997
3.591
+0.275
8.3%
jan 1, 1998
3.312
-0.278
-7.75%
jan 1, 1999
3.868
+0.555
16.77%
jan 1, 2000
2.784
-1.084
-28.02%
jan 1, 2001
2.966
+0.182
6.53%
jan 1, 2002
2.72
-0.246
-8.28%
jan 1, 2003
3.521
+0.801
29.43%
jan 1, 2004
4.233
+0.712
20.22%
jan 1, 2005
3.18
-1.053
-24.87%
jan 1, 2006
3.022
-0.158
-4.96%
jan 1, 2007
2.892
-0.13
-4.31%
jan 1, 2008
4.114
+1.222
42.26%
jan 1, 2009
4.656
+0.542
13.18%
jan 1, 2010
4.777
+0.121
2.61%
jan 1, 2011
3.322
-1.456
-30.47%
jan 1, 2012
3.147
-0.174
-5.25%
jan 1, 2013
3.991
+0.844
26.81%
jan 1, 2014
4.13
+0.139
3.47%
jan 1, 2015
4.632
+0.502
12.16%
Ranking of countries by current statistics by years


Comments: