29
/
en
AIzaSyAYiBZKx7MnpbEhh9jyipgxe19OcubqV5w
April 1, 2024
264187
Togo
TGO
true
2
1
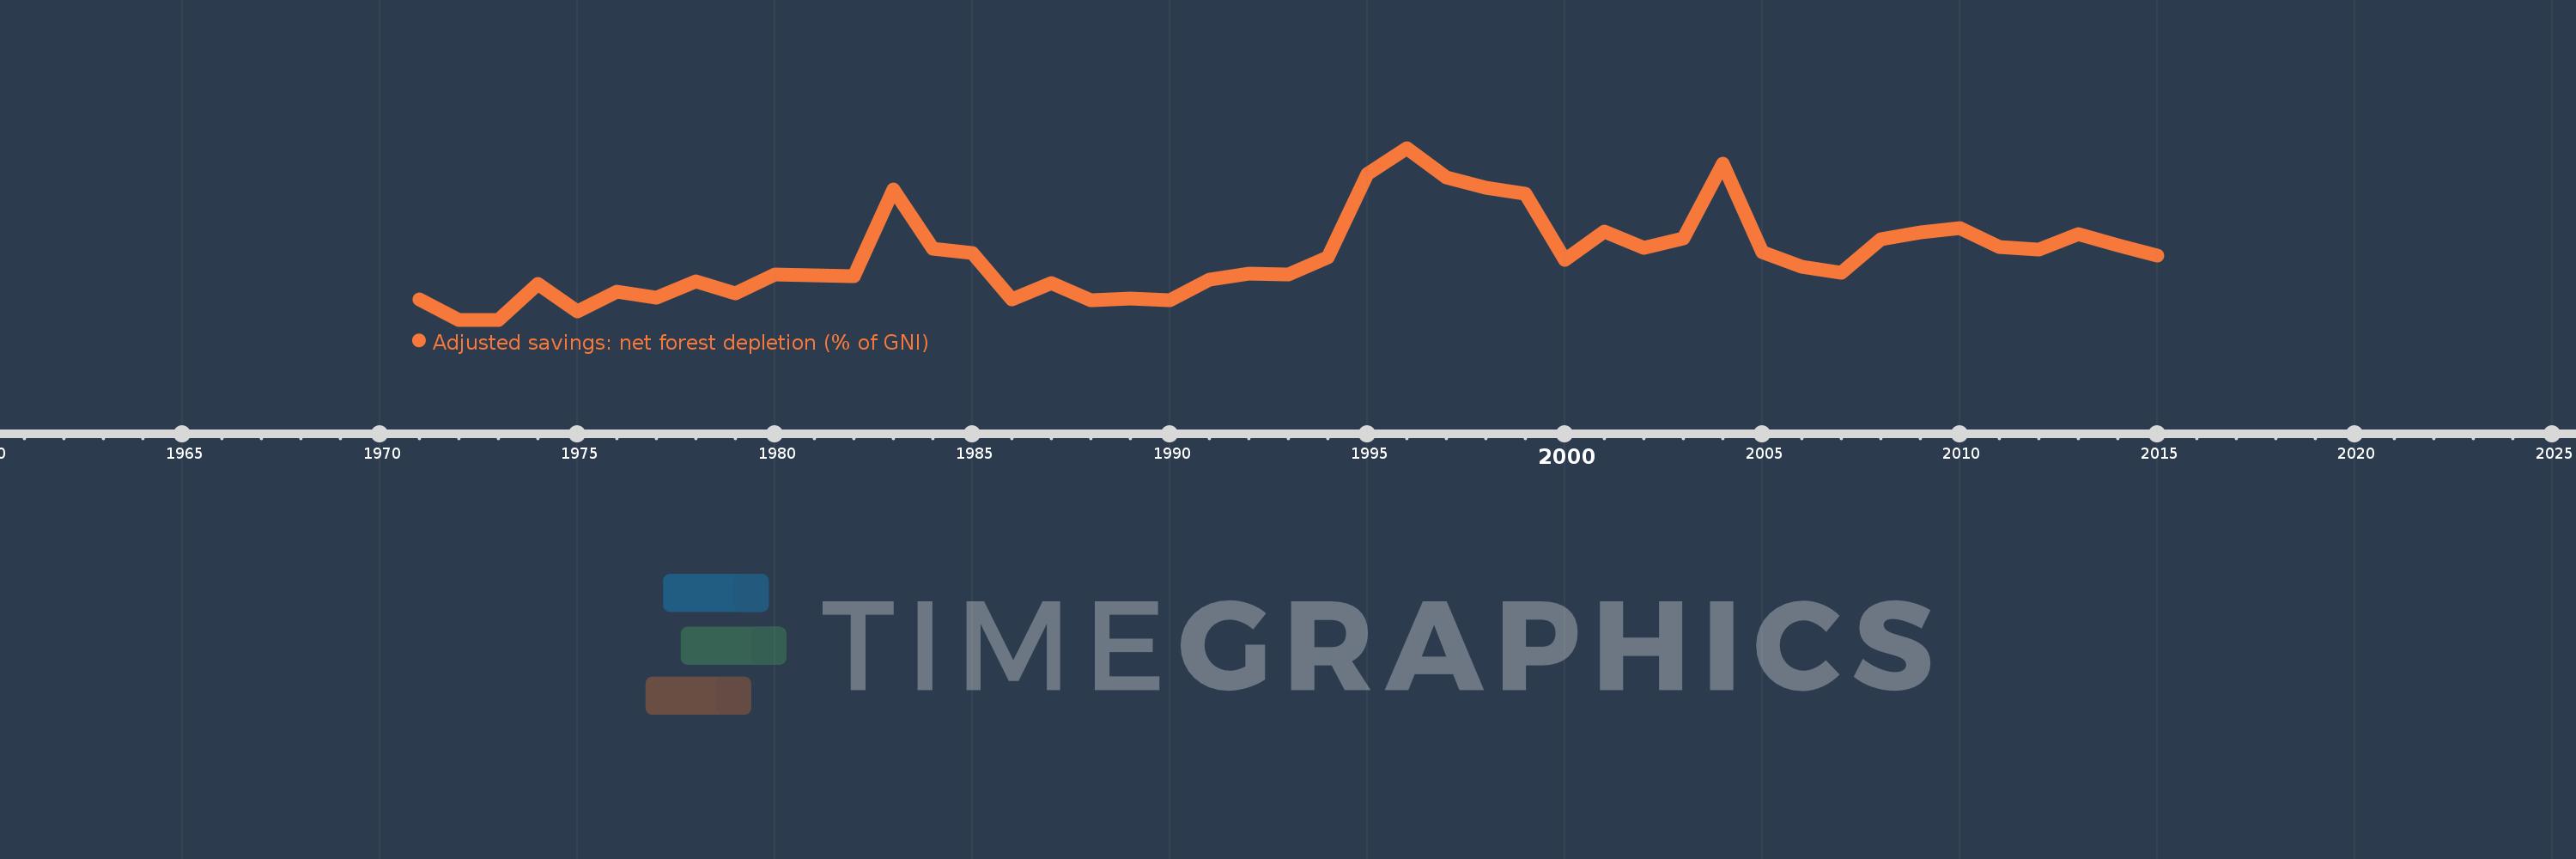
Adjusted savings: net forest depletion (% of GNI)
2015,2014,2013,2012,2011,2010,2009,2008,2007,2006,2005,2004,2003,2002,2001,2000,1999,1998,1997,1996,1995,1994,1993,1992,1991,1990,1989,1988,1987,1986,1985,1984,1983,1982,1981,1980,1979,1978,1977,1976,1975,1974,1973,1972,1971
This statistics in other country:
AfghanistanAlbaniaAlgeriaAngolaArab WorldArgentinaArmeniaAustraliaAustriaAzerbaijanBahamas, TheBahrainBangladeshBarbadosBelarusBelgiumBelizeBeninBhutanBoliviaBotswanaBrazilBrunei DarussalamBulgariaBurkina FasoBurundiCabo VerdeCambodiaCameroonCanadaCaribbean small statesCentral African RepublicCentral Europe and the BalticsChadChileChinaColombiaComorosCongo, Dem. Rep.Congo, Rep.Costa RicaCote d'IvoireCroatiaCubaCyprusCzech RepublicDenmarkDjiboutiDominicaDominican RepublicEarly-demographic dividendEast Asia & PacificEast Asia & Pacific (excluding high income)East Asia & Pacific (IDA & IBRD countries)EcuadorEgypt, Arab Rep.El SalvadorEquatorial GuineaEritreaEstoniaEthiopiaEuro areaEurope & Central AsiaEurope & Central Asia (excluding high income)Europe & Central Asia (IDA & IBRD countries)European UnionFijiFinlandFragile and conflict affected situationsFranceFrench PolynesiaGabonGambia, TheGeorgiaGermanyGhanaGreeceGuatemalaGuineaGuinea-BissauGuyanaHaitiHeavily indebted poor countries (HIPC)High incomeHondurasHong Kong SAR, ChinaHungaryIBRD onlyIcelandIDA & IBRD totalIDA blendIDA onlyIDA totalIndiaIndonesiaIran, Islamic Rep.IraqIrelandIsraelItalyJamaicaJapanJordanKazakhstanKenyaKiribatiKorea, Rep.KuwaitKyrgyz RepublicLao PDRLate-demographic dividendLatin America & Caribbean Latin America & Caribbean (excluding high income)Latin America & the Caribbean (IDA & IBRD countries)LatviaLeast developed countries: UN classificationLebanonLesothoLiberiaLibyaLithuaniaLow & middle incomeLow incomeLower middle incomeLuxembourgMacedonia, FYRMadagascarMalawiMalaysiaMaldivesMaliMauritaniaMauritiusMexicoMicronesia, Fed. Sts.Middle East & North AfricaMiddle East & North Africa (excluding high income)Middle East & North Africa (IDA & IBRD countries)Middle incomeMoldovaMongoliaMoroccoMozambiqueMyanmarNamibiaNepalNetherlandsNew CaledoniaNew ZealandNicaraguaNigerNigeriaNorth AmericaNorwayOECD membersOmanOther small statesPacific island small statesPakistanPanamaPapua New GuineaParaguayPeruPhilippinesPolandPortugalPost-demographic dividendPre-demographic dividendQatarRomaniaRussian FederationRwandaSamoaSao Tome and PrincipeSaudi ArabiaSenegalSeychellesSierra LeoneSingaporeSlovak RepublicSloveniaSmall statesSolomon IslandsSomaliaSouth AfricaSouth AsiaSouth Asia (IDA & IBRD)SpainSri LankaSt. LuciaSt. Vincent and the GrenadinesSub-Saharan Africa Sub-Saharan Africa (excluding high income)Sub-Saharan Africa (IDA & IBRD countries)SudanSurinameSwazilandSwedenSwitzerlandSyrian Arab RepublicTajikistanTanzaniaThailandTogoTongaTrinidad and TobagoTunisiaTurkeyTurkmenistanUgandaUkraineUnited Arab EmiratesUnited KingdomUnited StatesUpper middle incomeUruguayUzbekistanVanuatuVenezuela, RBVietnamWorldYemen, Rep.ZambiaZimbabwe Timeline:
This timeline shows a graph from 1971 to 2015 of Togo. No data until 1970. Number of actual observations by date: 45.
Source name:
World Development Indicators
Source organization:
World Bank staff estimates based on sources and methods in World Bank's "The Changing Wealth of Nations: Measuring Sustainable Development in the New Millennium" (2011).
Categories, topics:
Economy & Growth, Environment
Last updated:
apr 23, 2017
Indicators value changes by year
Maximum:
12.157
jan 1, 1996
At the date of observation
Value
Absolute change
Change from previous value
jan 1, 1971
4.557
+4.557
0.0%
jan 1, 1972
3.546
-1.011
-22.19%
jan 1, 1973
3.539
-0.006
-0.18%
jan 1, 1974
5.345
+1.805
51.01%
jan 1, 1975
3.965
-1.38
-25.81%
jan 1, 1976
4.965
+1.0
25.23%
jan 1, 1977
4.654
-0.311
-6.27%
jan 1, 1978
5.448
+0.794
17.07%
jan 1, 1979
4.854
-0.594
-10.9%
jan 1, 1980
5.805
+0.951
19.59%
jan 1, 1981
5.782
-0.023
-0.39%
jan 1, 1982
5.705
-0.077
-1.33%
jan 1, 1983
10.078
+4.373
76.65%
jan 1, 1984
7.109
-2.969
-29.46%
jan 1, 1985
6.898
-0.211
-2.97%
jan 1, 1986
4.579
-2.319
-33.62%
jan 1, 1987
5.395
+0.817
17.84%
jan 1, 1988
4.52
-0.875
-16.22%
jan 1, 1989
4.608
+0.088
1.94%
jan 1, 1990
4.512
-0.096
-2.08%
jan 1, 1991
5.548
+1.036
22.96%
jan 1, 1992
5.845
+0.297
5.35%
jan 1, 1993
5.792
-0.053
-0.91%
jan 1, 1994
6.666
+0.874
15.08%
jan 1, 1995
10.872
+4.206
63.09%
jan 1, 1996
12.157
+1.286
11.83%
jan 1, 1997
10.682
-1.475
-12.13%
jan 1, 1998
10.172
-0.511
-4.78%
jan 1, 1999
9.875
-0.296
-2.91%
jan 1, 2000
6.561
-3.314
-33.56%
jan 1, 2001
7.953
+1.391
21.2%
jan 1, 2002
7.141
-0.811
-10.2%
jan 1, 2003
7.623
+0.482
6.75%
jan 1, 2004
11.361
+3.738
49.03%
jan 1, 2005
6.933
-4.428
-38.97%
jan 1, 2006
6.201
-0.732
-10.56%
jan 1, 2007
5.905
-0.296
-4.77%
jan 1, 2008
7.565
+1.66
28.11%
jan 1, 2009
7.937
+0.372
4.92%
jan 1, 2010
8.125
+0.188
2.37%
jan 1, 2011
7.206
-0.919
-11.31%
jan 1, 2012
7.056
-0.15
-2.09%
jan 1, 2013
7.837
+0.781
11.07%
jan 1, 2014
7.283
-0.554
-7.07%
jan 1, 2015
6.746
-0.538
-7.38%
Ranking of countries by current statistics by years


Comments: