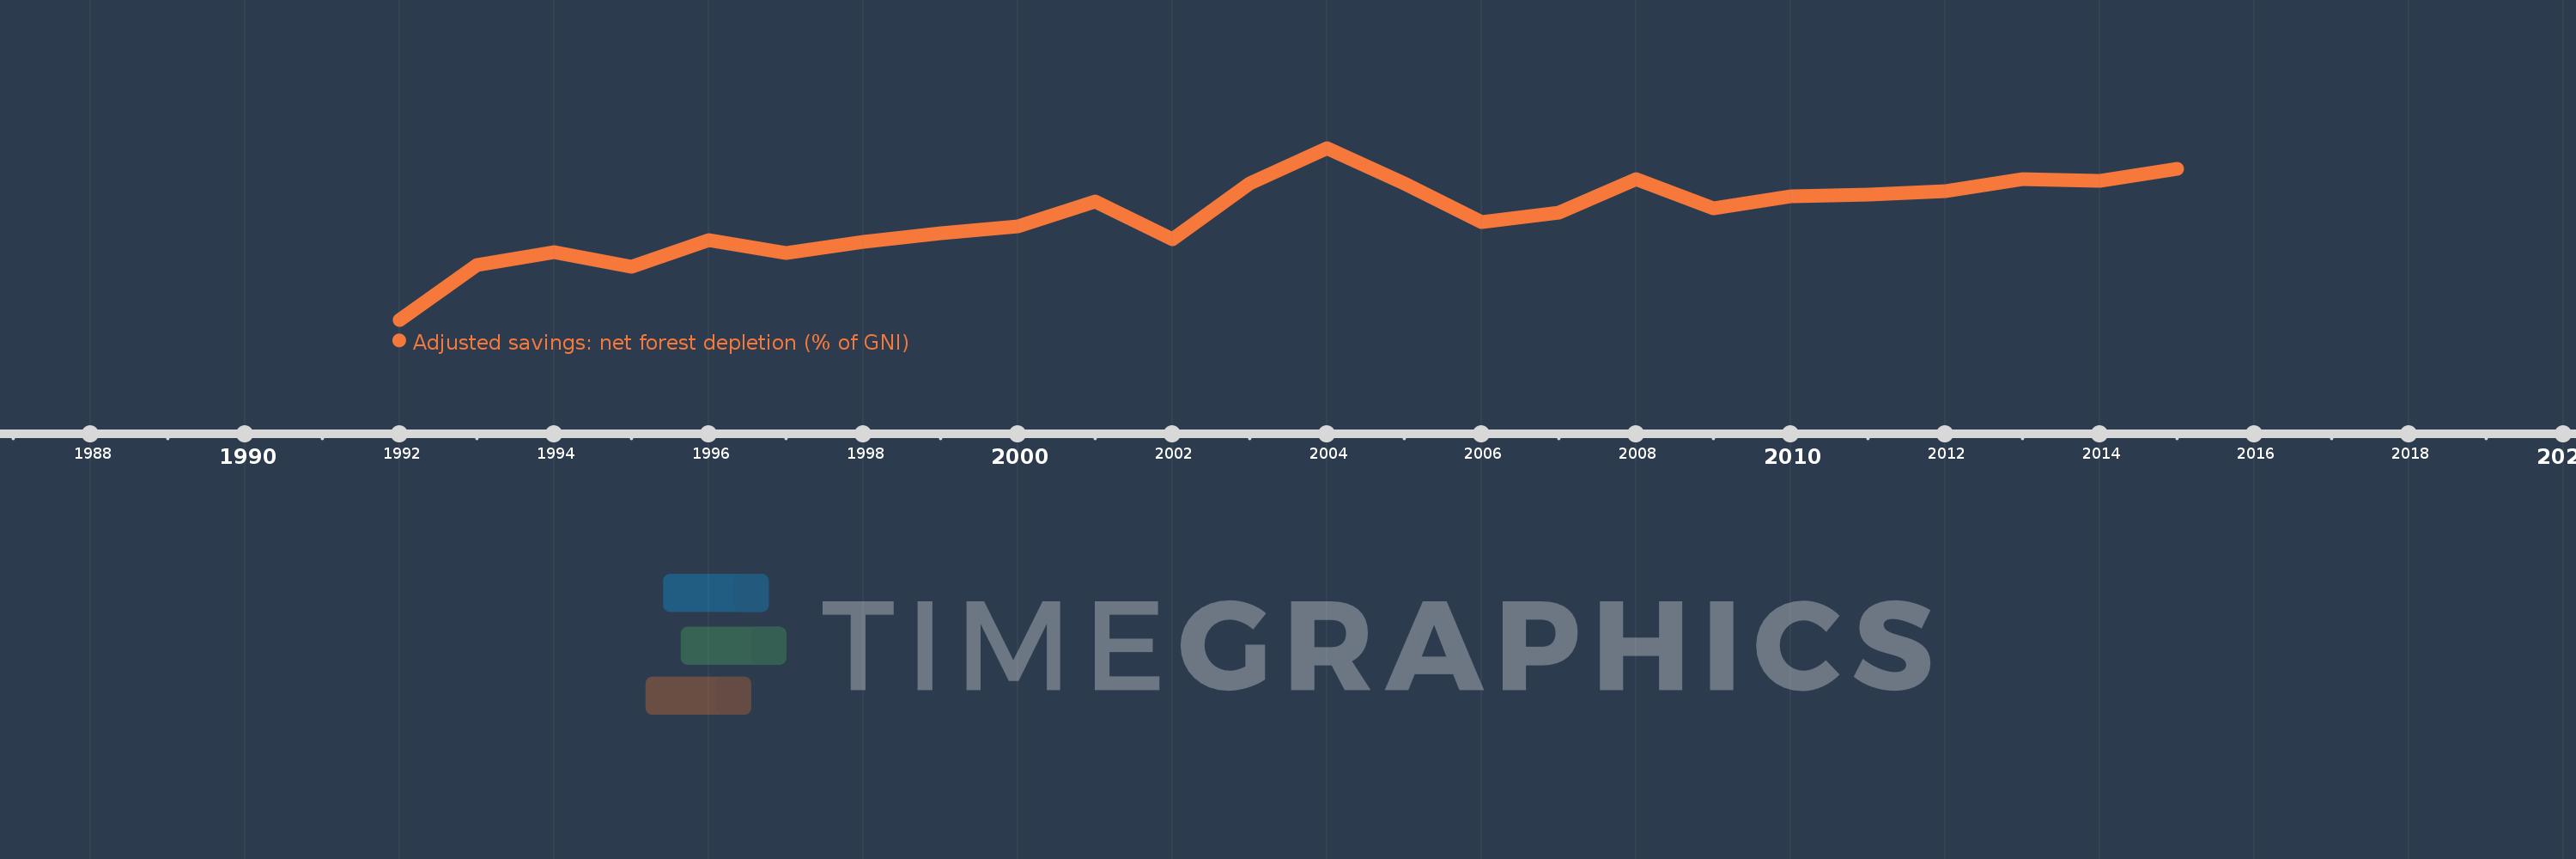
This timeline shows a graph from 1992 to 2015 of Poland. No data until 1991. Number of actual observations by date: 24.
Source name:
World Development Indicators
Source organization:
World Bank staff estimates based on sources and methods in World Bank's "The Changing Wealth of Nations: Measuring Sustainable Development in the New Millennium" (2011).
Categories, topics:
Economy & Growth, Environment
Last updated:
apr 23, 2017
Indicators value changes by year
Meaning:
0.192
Minimum:
0.079
jan 1, 1992
Maximum:
0.267
jan 1, 2004
At the date of observation
Value
Absolute change
Change from the previous value
jan 1, 1992
0.079
+0.079
0.0%
jan 1, 1993
0.139
+0.061
77.52%
jan 1, 1994
0.153
+0.013
9.68%
jan 1, 1995
0.137
-0.016
-10.36%
jan 1, 1996
0.166
+0.028
20.77%
jan 1, 1997
0.152
-0.013
-7.91%
jan 1, 1998
0.164
+0.011
7.5%
jan 1, 1999
0.174
+0.01
5.92%
jan 1, 2000
0.181
+0.007
4.3%
jan 1, 2001
0.208
+0.027
15.0%
jan 1, 2002
0.167
-0.042
-19.99%
jan 1, 2003
0.228
+0.062
37.11%
jan 1, 2004
0.267
+0.039
16.96%
jan 1, 2005
0.228
-0.039
-14.61%
jan 1, 2006
0.186
-0.042
-18.31%
jan 1, 2007
0.196
+0.01
5.39%
jan 1, 2008
0.233
+0.037
18.87%
jan 1, 2009
0.201
-0.033
-14.09%
jan 1, 2010
0.214
+0.013
6.59%
jan 1, 2011
0.216
+0.002
1.15%
jan 1, 2012
0.22
+0.004
1.81%
jan 1, 2013
0.233
+0.013
5.89%
jan 1, 2014
0.231
-0.002
-0.87%
jan 1, 2015
0.244
+0.013
5.66%
Ranking of countries by current statistics by years
