29
/
en
AIzaSyAYiBZKx7MnpbEhh9jyipgxe19OcubqV5w
April 1, 2024
55785
Pre-demographic dividend
PRE
false
2
1
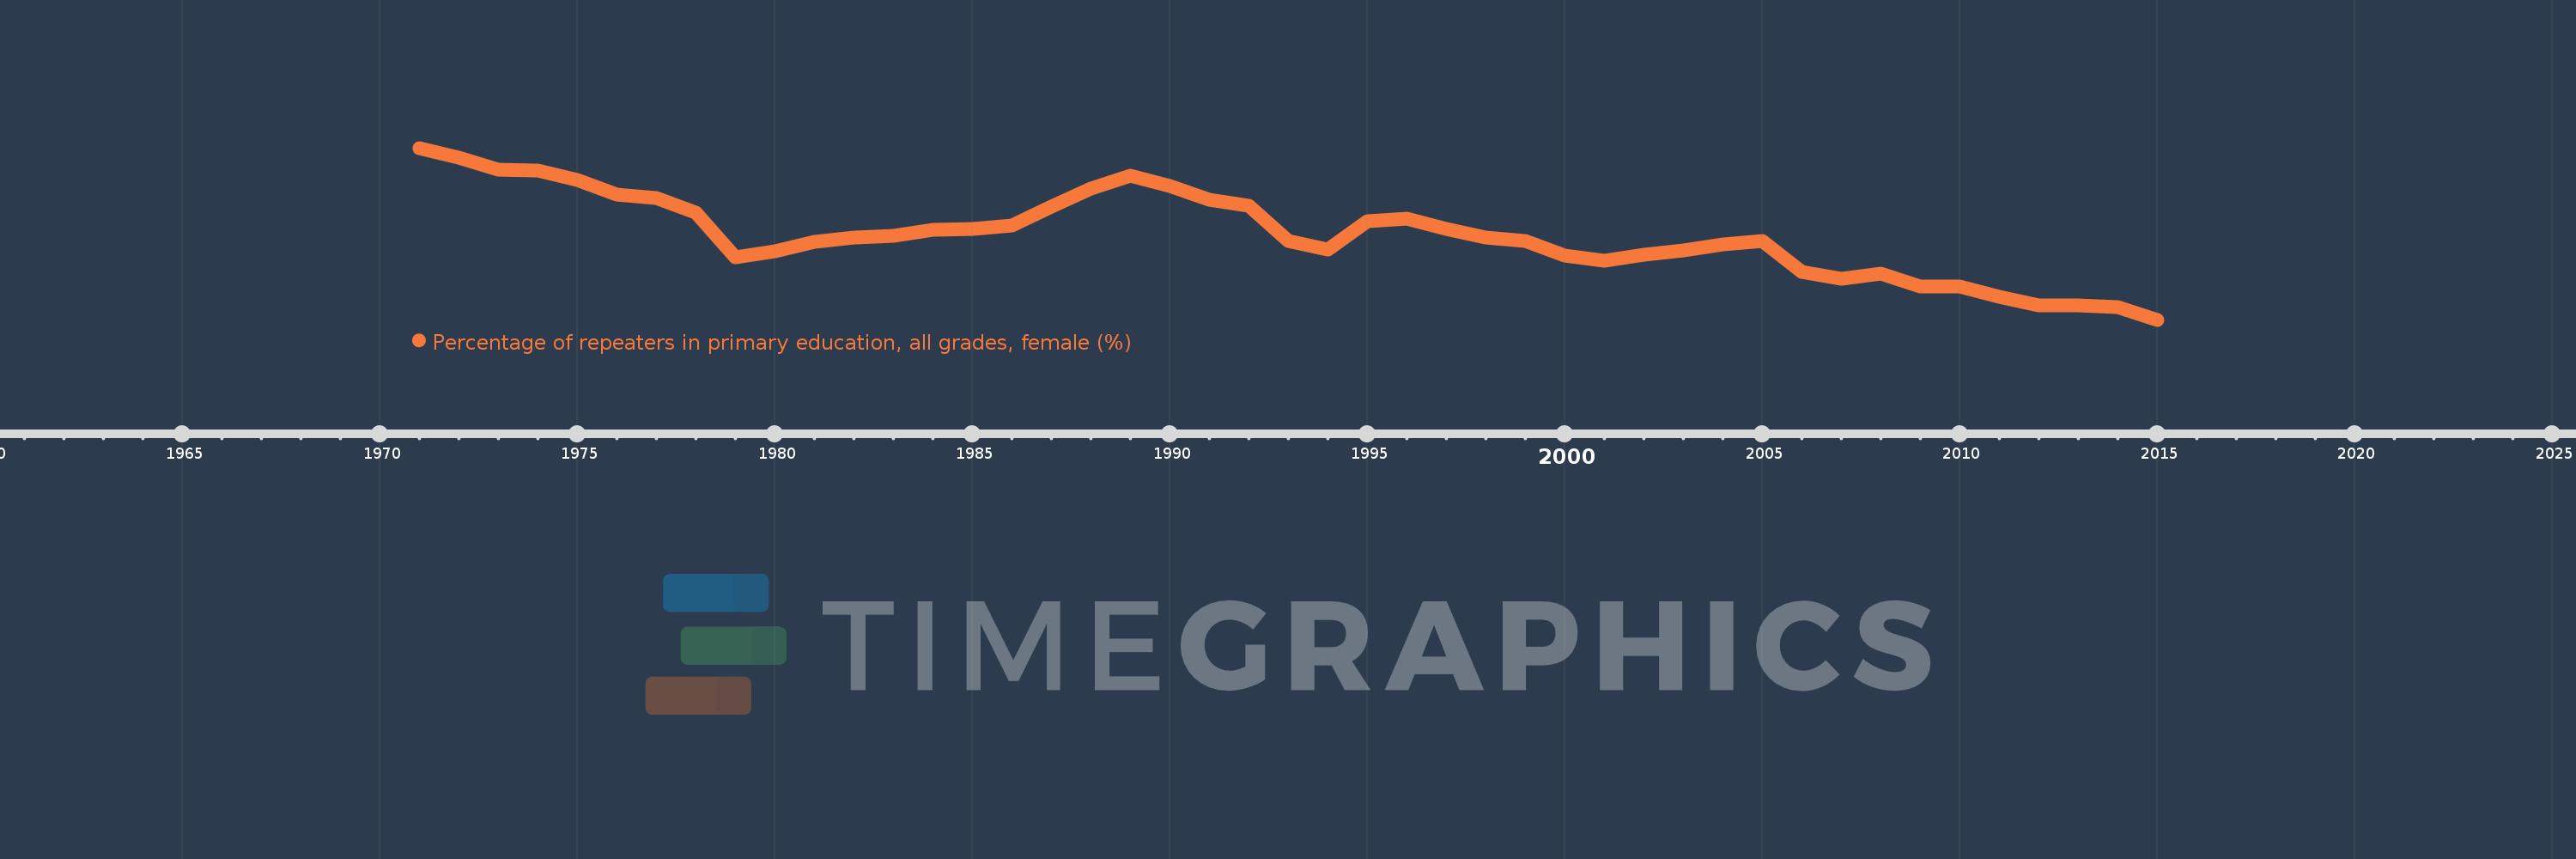
Percentage of repeaters in primary education, all grades, female (%)
2015,2014,2013,2012,2011,2010,2009,2008,2007,2006,2005,2004,2003,2002,2001,2000,1999,1998,1997,1996,1995,1994,1993,1992,1991,1990,1989,1988,1987,1986,1985,1984,1983,1982,1981,1980,1979,1978,1977,1976,1975,1974,1973,1972,1971
This statistics in other country:
AfghanistanAlbaniaAlgeriaAndorraAngolaAntigua and BarbudaArab WorldArgentinaArmeniaArubaAustriaAzerbaijanBahamas, TheBahrainBangladeshBelarusBelgiumBelizeBeninBermudaBhutanBoliviaBosnia and HerzegovinaBotswanaBrazilBritish Virgin IslandsBrunei DarussalamBulgariaBurkina FasoBurundiCabo VerdeCambodiaCameroonCanadaCaribbean small statesCayman IslandsCentral African RepublicCentral Europe and the BalticsChadChileChinaColombiaComorosCongo, Dem. Rep.Congo, Rep.Costa RicaCote d'IvoireCroatiaCubaCyprusCzech RepublicDenmarkDjiboutiDominicaDominican RepublicEarly-demographic dividendEast Asia & PacificEast Asia & Pacific (excluding high income)East Asia & Pacific (IDA & IBRD countries)EcuadorEgypt, Arab Rep.El SalvadorEquatorial GuineaEritreaEstoniaEthiopiaEuro areaEurope & Central AsiaEurope & Central Asia (excluding high income)Europe & Central Asia (IDA & IBRD countries)European UnionFijiFinlandFragile and conflict affected situationsFranceGabonGambia, TheGeorgiaGermanyGhanaGreeceGrenadaGuatemalaGuineaGuinea-BissauGuyanaHaitiHeavily indebted poor countries (HIPC)High incomeHondurasHong Kong SAR, ChinaHungaryIBRD onlyIcelandIDA & IBRD totalIDA blendIDA onlyIDA totalIndiaIndonesiaIran, Islamic Rep.IraqIrelandIsraelItalyJamaicaJapanJordanKazakhstanKenyaKiribatiKorea, Rep.KuwaitKyrgyz RepublicLao PDRLate-demographic dividendLatin America & Caribbean Latin America & Caribbean (excluding high income)Latin America & the Caribbean (IDA & IBRD countries)LatviaLeast developed countries: UN classificationLebanonLesothoLiberiaLibyaLiechtensteinLithuaniaLow & middle incomeLow incomeLower middle incomeLuxembourgMacao SAR, ChinaMacedonia, FYRMadagascarMalawiMalaysiaMaldivesMaliMaltaMauritaniaMauritiusMexicoMiddle East & North AfricaMiddle East & North Africa (excluding high income)Middle East & North Africa (IDA & IBRD countries)Middle incomeMoldovaMonacoMongoliaMontenegroMoroccoMozambiqueMyanmarNamibiaNauruNepalNetherlandsNew ZealandNicaraguaNigerNorwayOECD membersOmanOther small statesPacific island small statesPakistanPalauPanamaPapua New GuineaParaguayPeruPhilippinesPolandPortugalPost-demographic dividendPre-demographic dividendQatarRomaniaRussian FederationRwandaSamoaSan MarinoSao Tome and PrincipeSaudi ArabiaSenegalSerbiaSeychellesSierra LeoneSingaporeSint Maarten (Dutch part)Slovak RepublicSloveniaSmall statesSolomon IslandsSomaliaSouth AfricaSouth AsiaSouth Asia (IDA & IBRD)South SudanSpainSri LankaSt. Kitts and NevisSt. LuciaSt. Vincent and the GrenadinesSub-Saharan Africa Sub-Saharan Africa (excluding high income)Sub-Saharan Africa (IDA & IBRD countries)SudanSurinameSwazilandSwedenSwitzerlandSyrian Arab RepublicTajikistanTanzaniaThailandTimor-LesteTogoTongaTrinidad and TobagoTunisiaTurkeyTurks and Caicos IslandsTuvaluUgandaUkraineUnited Arab EmiratesUnited KingdomUpper middle incomeUruguayUzbekistanVanuatuVenezuela, RBVietnamWest Bank and GazaWorldYemen, Rep.ZambiaZimbabwe Timeline:
This timeline shows a graph from 1971 to 2015 of Pre-demographic dividend. No data until 1970. Number of actual observations by date: 45.
Source name:
World Development Indicators
Source organization:
UNESCO Institute for Statistics
Categories, topics:
Education, Gender
Last updated:
apr 23, 2017
Indicators value changes by year
Maximum:
12.859
jan 1, 1971
At the date of observation
Value
Absolute change
Change from previous value
jan 1, 1971
12.859
+12.859
0.0%
jan 1, 1972
12.614
-0.246
-1.91%
jan 1, 1973
12.32
-0.294
-2.33%
jan 1, 1974
12.306
-0.014
-0.12%
jan 1, 1975
12.067
-0.239
-1.94%
jan 1, 1976
11.713
-0.354
-2.94%
jan 1, 1977
11.64
-0.073
-0.62%
jan 1, 1978
11.269
-0.371
-3.19%
jan 1, 1979
10.182
-1.087
-9.65%
jan 1, 1980
10.322
+0.14
1.38%
jan 1, 1981
10.551
+0.23
2.22%
jan 1, 1982
10.66
+0.109
1.03%
jan 1, 1983
10.716
+0.056
0.52%
jan 1, 1984
10.859
+0.144
1.34%
jan 1, 1985
10.883
+0.024
0.22%
jan 1, 1986
10.961
+0.078
0.72%
jan 1, 1987
11.432
+0.471
4.29%
jan 1, 1988
11.86
+0.428
3.74%
jan 1, 1989
12.183
+0.323
2.72%
jan 1, 1990
11.922
-0.26
-2.14%
jan 1, 1991
11.592
-0.33
-2.77%
jan 1, 1992
11.441
-0.151
-1.3%
jan 1, 1993
10.582
-0.859
-7.51%
jan 1, 1994
10.38
-0.202
-1.91%
jan 1, 1995
11.07
+0.69
6.65%
jan 1, 1996
11.119
+0.049
0.44%
jan 1, 1997
10.872
-0.248
-2.23%
jan 1, 1998
10.665
-0.207
-1.9%
jan 1, 1999
10.585
-0.08
-0.75%
jan 1, 2000
10.226
-0.359
-3.39%
jan 1, 2001
10.088
-0.138
-1.35%
jan 1, 2002
10.242
+0.154
1.52%
jan 1, 2003
10.348
+0.107
1.04%
jan 1, 2004
10.498
+0.15
1.45%
jan 1, 2005
10.58
+0.082
0.78%
jan 1, 2006
9.816
-0.764
-7.22%
jan 1, 2007
9.656
-0.16
-1.63%
jan 1, 2008
9.771
+0.114
1.18%
jan 1, 2009
9.464
-0.306
-3.14%
jan 1, 2010
9.464
0.0
0.0%
jan 1, 2011
9.207
-0.257
-2.72%
jan 1, 2012
9.001
-0.206
-2.23%
jan 1, 2013
9.001
+0.0
0.0%
jan 1, 2014
8.963
-0.038
-0.43%
jan 1, 2015
8.651
-0.312
-3.48%
Ranking of countries by current statistics by years


Comments: