29
/
en
AIzaSyAYiBZKx7MnpbEhh9jyipgxe19OcubqV5w
April 1, 2024
33758
European Union
EUU
false
2
1
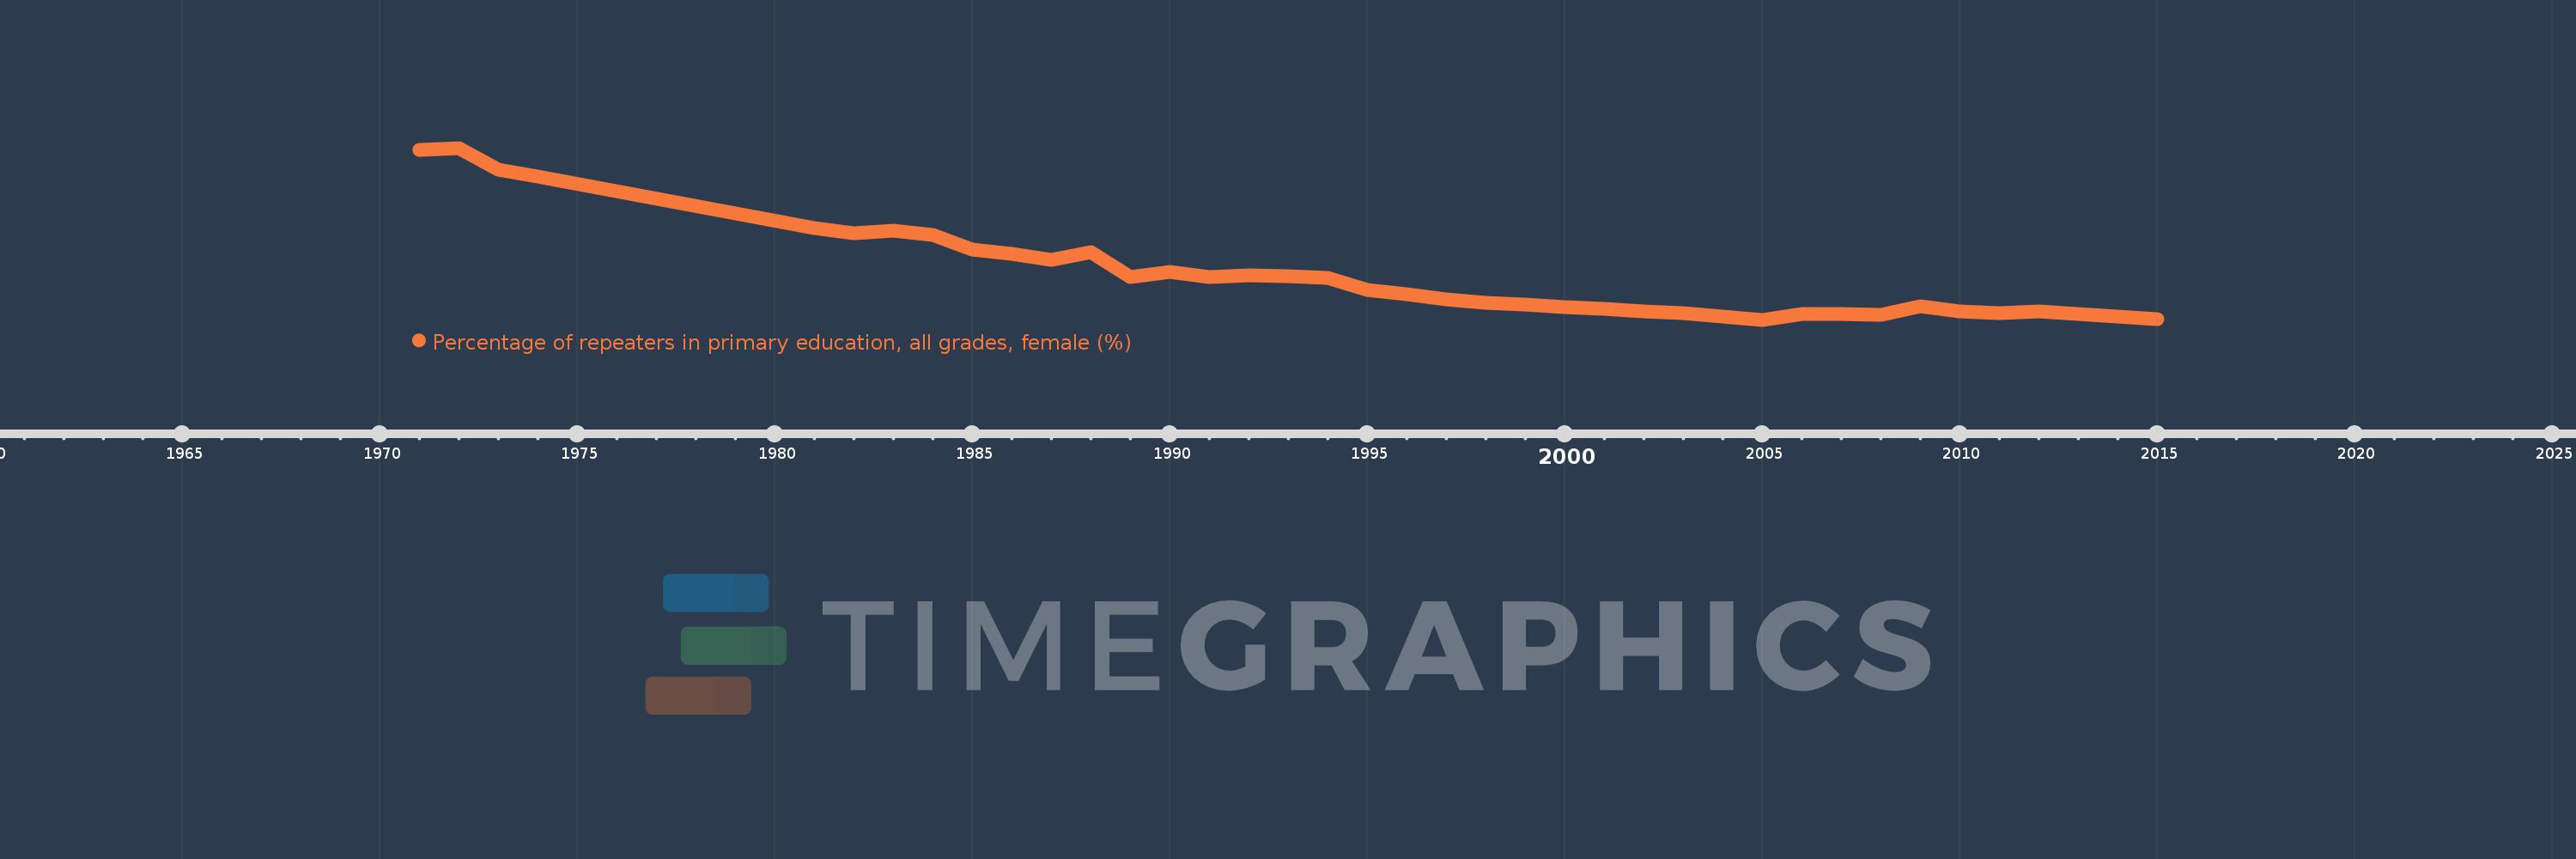
Percentage of repeaters in primary education, all grades, female (%)
2015,2014,2013,2012,2011,2010,2009,2008,2007,2006,2005,2004,2003,2002,2001,2000,1999,1998,1997,1996,1995,1994,1993,1992,1991,1990,1989,1988,1987,1986,1985,1984,1983,1982,1981,1974,1973,1972,1971
This statistics in other country:
AfghanistanAlbaniaAlgeriaAndorraAngolaAntigua and BarbudaArab WorldArgentinaArmeniaArubaAustriaAzerbaijanBahamas, TheBahrainBangladeshBelarusBelgiumBelizeBeninBermudaBhutanBoliviaBosnia and HerzegovinaBotswanaBrazilBritish Virgin IslandsBrunei DarussalamBulgariaBurkina FasoBurundiCabo VerdeCambodiaCameroonCanadaCaribbean small statesCayman IslandsCentral African RepublicCentral Europe and the BalticsChadChileChinaColombiaComorosCongo, Dem. Rep.Congo, Rep.Costa RicaCote d'IvoireCroatiaCubaCyprusCzech RepublicDenmarkDjiboutiDominicaDominican RepublicEarly-demographic dividendEast Asia & PacificEast Asia & Pacific (excluding high income)East Asia & Pacific (IDA & IBRD countries)EcuadorEgypt, Arab Rep.El SalvadorEquatorial GuineaEritreaEstoniaEthiopiaEuro areaEurope & Central AsiaEurope & Central Asia (excluding high income)Europe & Central Asia (IDA & IBRD countries)European UnionFijiFinlandFragile and conflict affected situationsFranceGabonGambia, TheGeorgiaGermanyGhanaGreeceGrenadaGuatemalaGuineaGuinea-BissauGuyanaHaitiHeavily indebted poor countries (HIPC)High incomeHondurasHong Kong SAR, ChinaHungaryIBRD onlyIcelandIDA & IBRD totalIDA blendIDA onlyIDA totalIndiaIndonesiaIran, Islamic Rep.IraqIrelandIsraelItalyJamaicaJapanJordanKazakhstanKenyaKiribatiKorea, Rep.KuwaitKyrgyz RepublicLao PDRLate-demographic dividendLatin America & Caribbean Latin America & Caribbean (excluding high income)Latin America & the Caribbean (IDA & IBRD countries)LatviaLeast developed countries: UN classificationLebanonLesothoLiberiaLibyaLiechtensteinLithuaniaLow & middle incomeLow incomeLower middle incomeLuxembourgMacao SAR, ChinaMacedonia, FYRMadagascarMalawiMalaysiaMaldivesMaliMaltaMauritaniaMauritiusMexicoMiddle East & North AfricaMiddle East & North Africa (excluding high income)Middle East & North Africa (IDA & IBRD countries)Middle incomeMoldovaMonacoMongoliaMontenegroMoroccoMozambiqueMyanmarNamibiaNauruNepalNetherlandsNew ZealandNicaraguaNigerNorwayOECD membersOmanOther small statesPacific island small statesPakistanPalauPanamaPapua New GuineaParaguayPeruPhilippinesPolandPortugalPost-demographic dividendPre-demographic dividendQatarRomaniaRussian FederationRwandaSamoaSan MarinoSao Tome and PrincipeSaudi ArabiaSenegalSerbiaSeychellesSierra LeoneSingaporeSint Maarten (Dutch part)Slovak RepublicSloveniaSmall statesSolomon IslandsSomaliaSouth AfricaSouth AsiaSouth Asia (IDA & IBRD)South SudanSpainSri LankaSt. Kitts and NevisSt. LuciaSt. Vincent and the GrenadinesSub-Saharan Africa Sub-Saharan Africa (excluding high income)Sub-Saharan Africa (IDA & IBRD countries)SudanSurinameSwazilandSwedenSwitzerlandSyrian Arab RepublicTajikistanTanzaniaThailandTimor-LesteTogoTongaTrinidad and TobagoTunisiaTurkeyTurks and Caicos IslandsTuvaluUgandaUkraineUnited Arab EmiratesUnited KingdomUpper middle incomeUruguayUzbekistanVanuatuVenezuela, RBVietnamWest Bank and GazaWorldYemen, Rep.ZambiaZimbabwe Timeline:
This timeline shows a graph from 1971 to 2015 of European Union. No data until 1970. Number of actual observations by date: 39.
Source name:
World Development Indicators
Source organization:
UNESCO Institute for Statistics
Categories, topics:
Education, Gender
Last updated:
apr 23, 2017
Indicators value changes by year
At the date of observation
Value
Absolute change
Change from previous value
jan 1, 1971
4.644
+4.644
0.0%
jan 1, 1972
4.675
+0.031
0.67%
jan 1, 1973
4.389
-0.286
-6.12%
jan 1, 1974
4.299
-0.091
-2.07%
jan 1, 1981
3.632
-0.667
-15.52%
jan 1, 1982
3.56
-0.071
-1.96%
jan 1, 1983
3.596
+0.036
1.0%
jan 1, 1984
3.546
-0.05
-1.4%
jan 1, 1985
3.353
-0.193
-5.44%
jan 1, 1986
3.294
-0.059
-1.76%
jan 1, 1987
3.222
-0.072
-2.2%
jan 1, 1988
3.316
+0.095
2.93%
jan 1, 1989
2.994
-0.322
-9.72%
jan 1, 1990
3.068
+0.074
2.48%
jan 1, 1991
3.0
-0.068
-2.22%
jan 1, 1992
3.013
+0.013
0.43%
jan 1, 1993
3.011
-0.002
-0.06%
jan 1, 1994
2.983
-0.028
-0.94%
jan 1, 1995
2.831
-0.152
-5.09%
jan 1, 1996
2.776
-0.055
-1.95%
jan 1, 1997
2.703
-0.073
-2.61%
jan 1, 1998
2.664
-0.04
-1.47%
jan 1, 1999
2.633
-0.03
-1.14%
jan 1, 2000
2.603
-0.03
-1.13%
jan 1, 2001
2.585
-0.018
-0.71%
jan 1, 2002
2.55
-0.035
-1.36%
jan 1, 2003
2.523
-0.027
-1.04%
jan 1, 2004
2.48
-0.044
-1.73%
jan 1, 2005
2.44
-0.04
-1.6%
jan 1, 2006
2.51
+0.07
2.88%
jan 1, 2007
2.517
+0.007
0.27%
jan 1, 2008
2.501
-0.015
-0.62%
jan 1, 2009
2.619
+0.117
4.7%
jan 1, 2010
2.55
-0.069
-2.63%
jan 1, 2011
2.531
-0.019
-0.74%
jan 1, 2012
2.553
+0.021
0.85%
jan 1, 2013
2.51
-0.042
-1.66%
jan 1, 2014
2.476
-0.034
-1.37%
jan 1, 2015
2.446
-0.029
-1.19%
Ranking of countries by current statistics by years


Comments: