29
/
en
AIzaSyAYiBZKx7MnpbEhh9jyipgxe19OcubqV5w
April 1, 2024
53706
Other small states
OSS
false
2
1
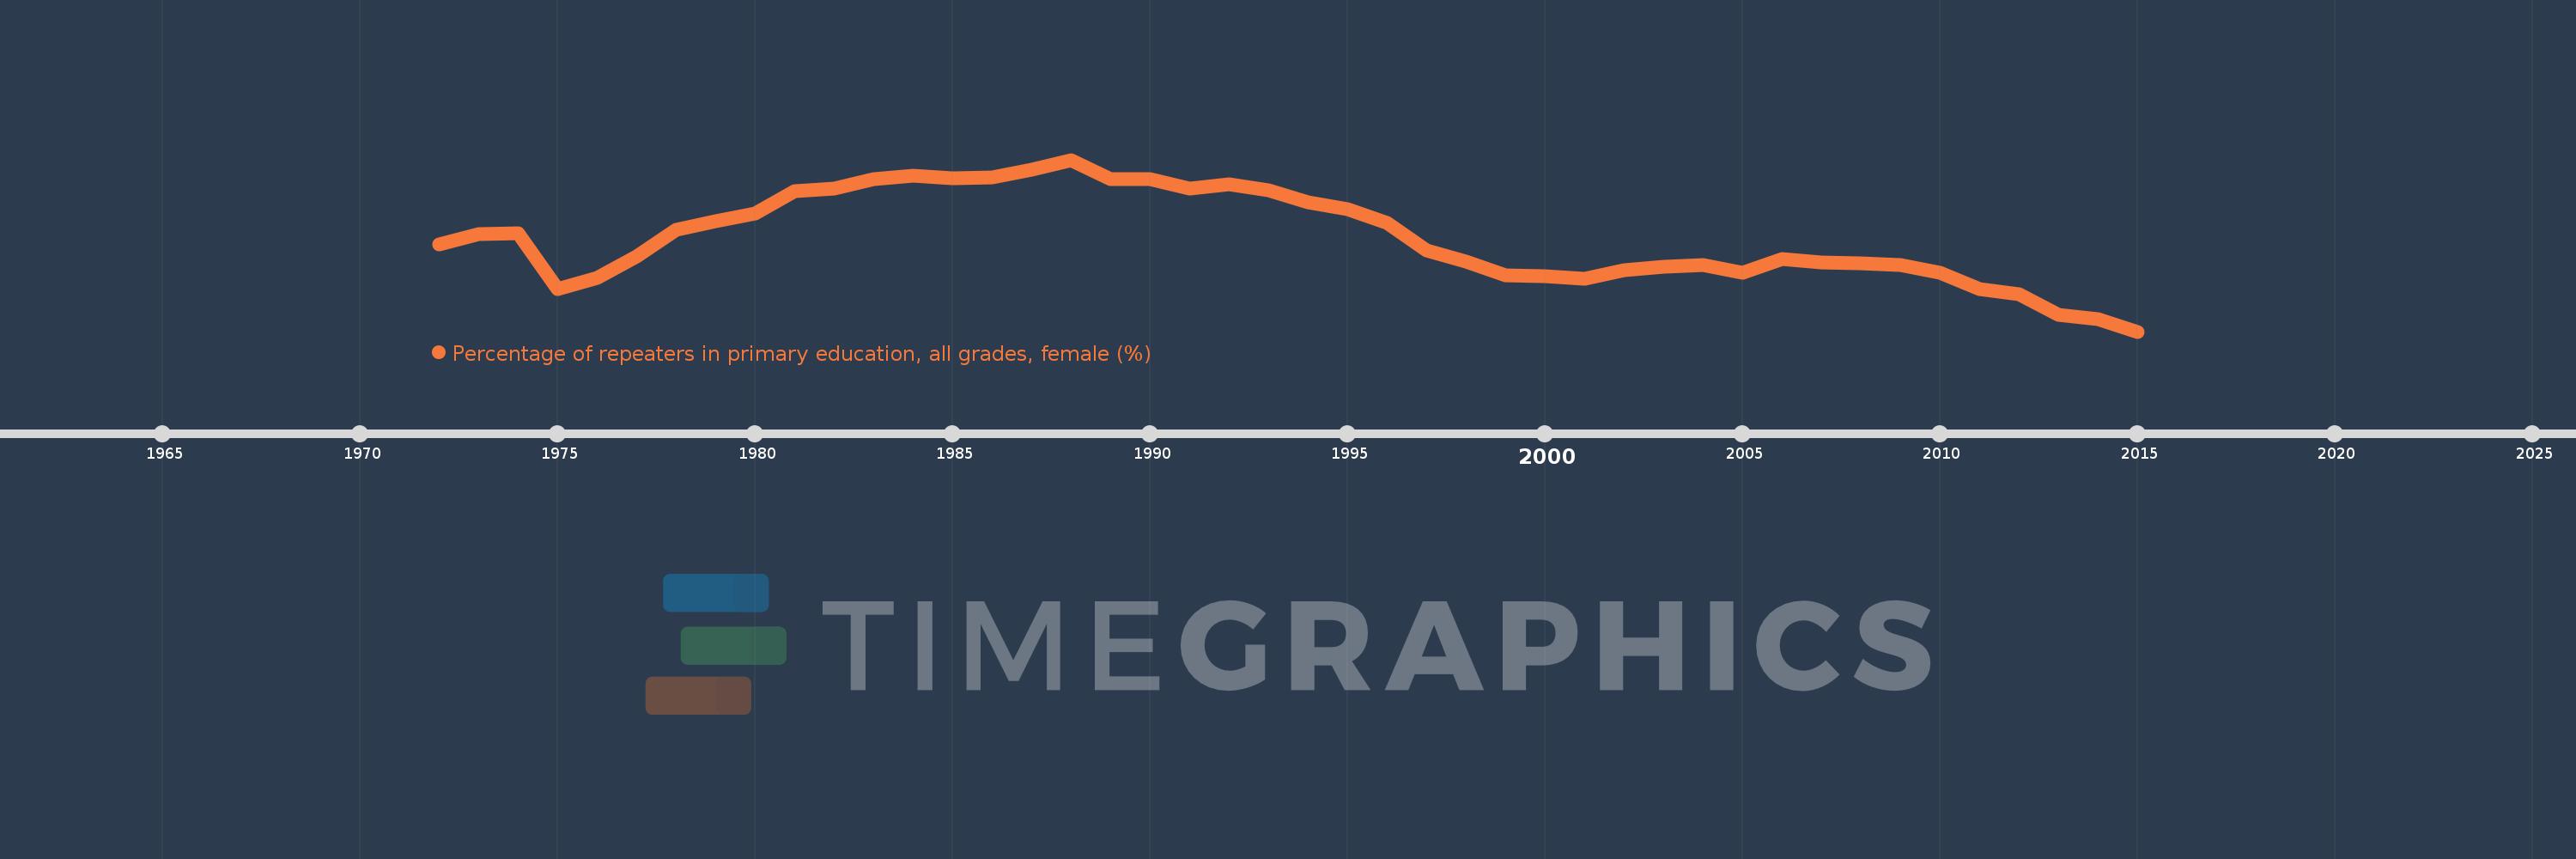
Percentage of repeaters in primary education, all grades, female (%)
2015,2014,2013,2012,2011,2010,2009,2008,2007,2006,2005,2004,2003,2002,2001,2000,1999,1998,1997,1996,1995,1994,1993,1992,1991,1990,1989,1988,1987,1986,1985,1984,1983,1982,1981,1980,1979,1978,1977,1976,1975,1974,1973,1972
This statistics in other country:
AfghanistanAlbaniaAlgeriaAndorraAngolaAntigua and BarbudaArab WorldArgentinaArmeniaArubaAustriaAzerbaijanBahamas, TheBahrainBangladeshBelarusBelgiumBelizeBeninBermudaBhutanBoliviaBosnia and HerzegovinaBotswanaBrazilBritish Virgin IslandsBrunei DarussalamBulgariaBurkina FasoBurundiCabo VerdeCambodiaCameroonCanadaCaribbean small statesCayman IslandsCentral African RepublicCentral Europe and the BalticsChadChileChinaColombiaComorosCongo, Dem. Rep.Congo, Rep.Costa RicaCote d'IvoireCroatiaCubaCyprusCzech RepublicDenmarkDjiboutiDominicaDominican RepublicEarly-demographic dividendEast Asia & PacificEast Asia & Pacific (excluding high income)East Asia & Pacific (IDA & IBRD countries)EcuadorEgypt, Arab Rep.El SalvadorEquatorial GuineaEritreaEstoniaEthiopiaEuro areaEurope & Central AsiaEurope & Central Asia (excluding high income)Europe & Central Asia (IDA & IBRD countries)European UnionFijiFinlandFragile and conflict affected situationsFranceGabonGambia, TheGeorgiaGermanyGhanaGreeceGrenadaGuatemalaGuineaGuinea-BissauGuyanaHaitiHeavily indebted poor countries (HIPC)High incomeHondurasHong Kong SAR, ChinaHungaryIBRD onlyIcelandIDA & IBRD totalIDA blendIDA onlyIDA totalIndiaIndonesiaIran, Islamic Rep.IraqIrelandIsraelItalyJamaicaJapanJordanKazakhstanKenyaKiribatiKorea, Rep.KuwaitKyrgyz RepublicLao PDRLate-demographic dividendLatin America & Caribbean Latin America & Caribbean (excluding high income)Latin America & the Caribbean (IDA & IBRD countries)LatviaLeast developed countries: UN classificationLebanonLesothoLiberiaLibyaLiechtensteinLithuaniaLow & middle incomeLow incomeLower middle incomeLuxembourgMacao SAR, ChinaMacedonia, FYRMadagascarMalawiMalaysiaMaldivesMaliMaltaMauritaniaMauritiusMexicoMiddle East & North AfricaMiddle East & North Africa (excluding high income)Middle East & North Africa (IDA & IBRD countries)Middle incomeMoldovaMonacoMongoliaMontenegroMoroccoMozambiqueMyanmarNamibiaNauruNepalNetherlandsNew ZealandNicaraguaNigerNorwayOECD membersOmanOther small statesPacific island small statesPakistanPalauPanamaPapua New GuineaParaguayPeruPhilippinesPolandPortugalPost-demographic dividendPre-demographic dividendQatarRomaniaRussian FederationRwandaSamoaSan MarinoSao Tome and PrincipeSaudi ArabiaSenegalSerbiaSeychellesSierra LeoneSingaporeSint Maarten (Dutch part)Slovak RepublicSloveniaSmall statesSolomon IslandsSomaliaSouth AfricaSouth AsiaSouth Asia (IDA & IBRD)South SudanSpainSri LankaSt. Kitts and NevisSt. LuciaSt. Vincent and the GrenadinesSub-Saharan Africa Sub-Saharan Africa (excluding high income)Sub-Saharan Africa (IDA & IBRD countries)SudanSurinameSwazilandSwedenSwitzerlandSyrian Arab RepublicTajikistanTanzaniaThailandTimor-LesteTogoTongaTrinidad and TobagoTunisiaTurkeyTurks and Caicos IslandsTuvaluUgandaUkraineUnited Arab EmiratesUnited KingdomUpper middle incomeUruguayUzbekistanVanuatuVenezuela, RBVietnamWest Bank and GazaWorldYemen, Rep.ZambiaZimbabwe Timeline:
This timeline shows a graph from 1972 to 2015 of Other small states. No data until 1971. Number of actual observations by date: 44.
Source name:
World Development Indicators
Source organization:
UNESCO Institute for Statistics
Categories, topics:
Education, Gender
Last updated:
apr 23, 2017
Indicators value changes by year
Maximum:
16.386
jan 1, 1988
At the date of observation
Value
Absolute change
Change from previous value
jan 1, 1972
13.441
+13.441
0.0%
jan 1, 1973
13.778
+0.337
2.51%
jan 1, 1974
13.831
+0.053
0.38%
jan 1, 1975
11.872
-1.958
-14.16%
jan 1, 1976
12.245
+0.373
3.14%
jan 1, 1977
13.004
+0.758
6.19%
jan 1, 1978
13.948
+0.944
7.26%
jan 1, 1979
14.245
+0.297
2.13%
jan 1, 1980
14.512
+0.267
1.87%
jan 1, 1981
15.297
+0.785
5.41%
jan 1, 1982
15.37
+0.073
0.48%
jan 1, 1983
15.715
+0.345
2.25%
jan 1, 1984
15.826
+0.111
0.71%
jan 1, 1985
15.738
-0.089
-0.56%
jan 1, 1986
15.761
+0.023
0.15%
jan 1, 1987
16.033
+0.273
1.73%
jan 1, 1988
16.386
+0.352
2.2%
jan 1, 1989
15.711
-0.675
-4.12%
jan 1, 1990
15.716
+0.004
0.03%
jan 1, 1991
15.385
-0.331
-2.1%
jan 1, 1992
15.52
+0.135
0.88%
jan 1, 1993
15.312
-0.208
-1.34%
jan 1, 1994
14.888
-0.424
-2.77%
jan 1, 1995
14.662
-0.227
-1.52%
jan 1, 1996
14.181
-0.481
-3.28%
jan 1, 1997
13.217
-0.964
-6.8%
jan 1, 1998
12.831
-0.386
-2.92%
jan 1, 1999
12.359
-0.472
-3.68%
jan 1, 2000
12.325
-0.034
-0.27%
jan 1, 2001
12.217
-0.109
-0.88%
jan 1, 2002
12.532
+0.315
2.58%
jan 1, 2003
12.662
+0.131
1.04%
jan 1, 2004
12.703
+0.041
0.32%
jan 1, 2005
12.445
-0.258
-2.03%
jan 1, 2006
12.918
+0.473
3.8%
jan 1, 2007
12.801
-0.116
-0.9%
jan 1, 2008
12.779
-0.023
-0.18%
jan 1, 2009
12.694
-0.085
-0.67%
jan 1, 2010
12.445
-0.249
-1.96%
jan 1, 2011
11.863
-0.582
-4.68%
jan 1, 2012
11.673
-0.19
-1.6%
jan 1, 2013
10.956
-0.716
-6.14%
jan 1, 2014
10.809
-0.147
-1.35%
jan 1, 2015
10.38
-0.429
-3.97%
Ranking of countries by current statistics by years


Comments: