29
/
en
AIzaSyAYiBZKx7MnpbEhh9jyipgxe19OcubqV5w
April 1, 2024
102858
Central African Republic
CAF
true
2
1
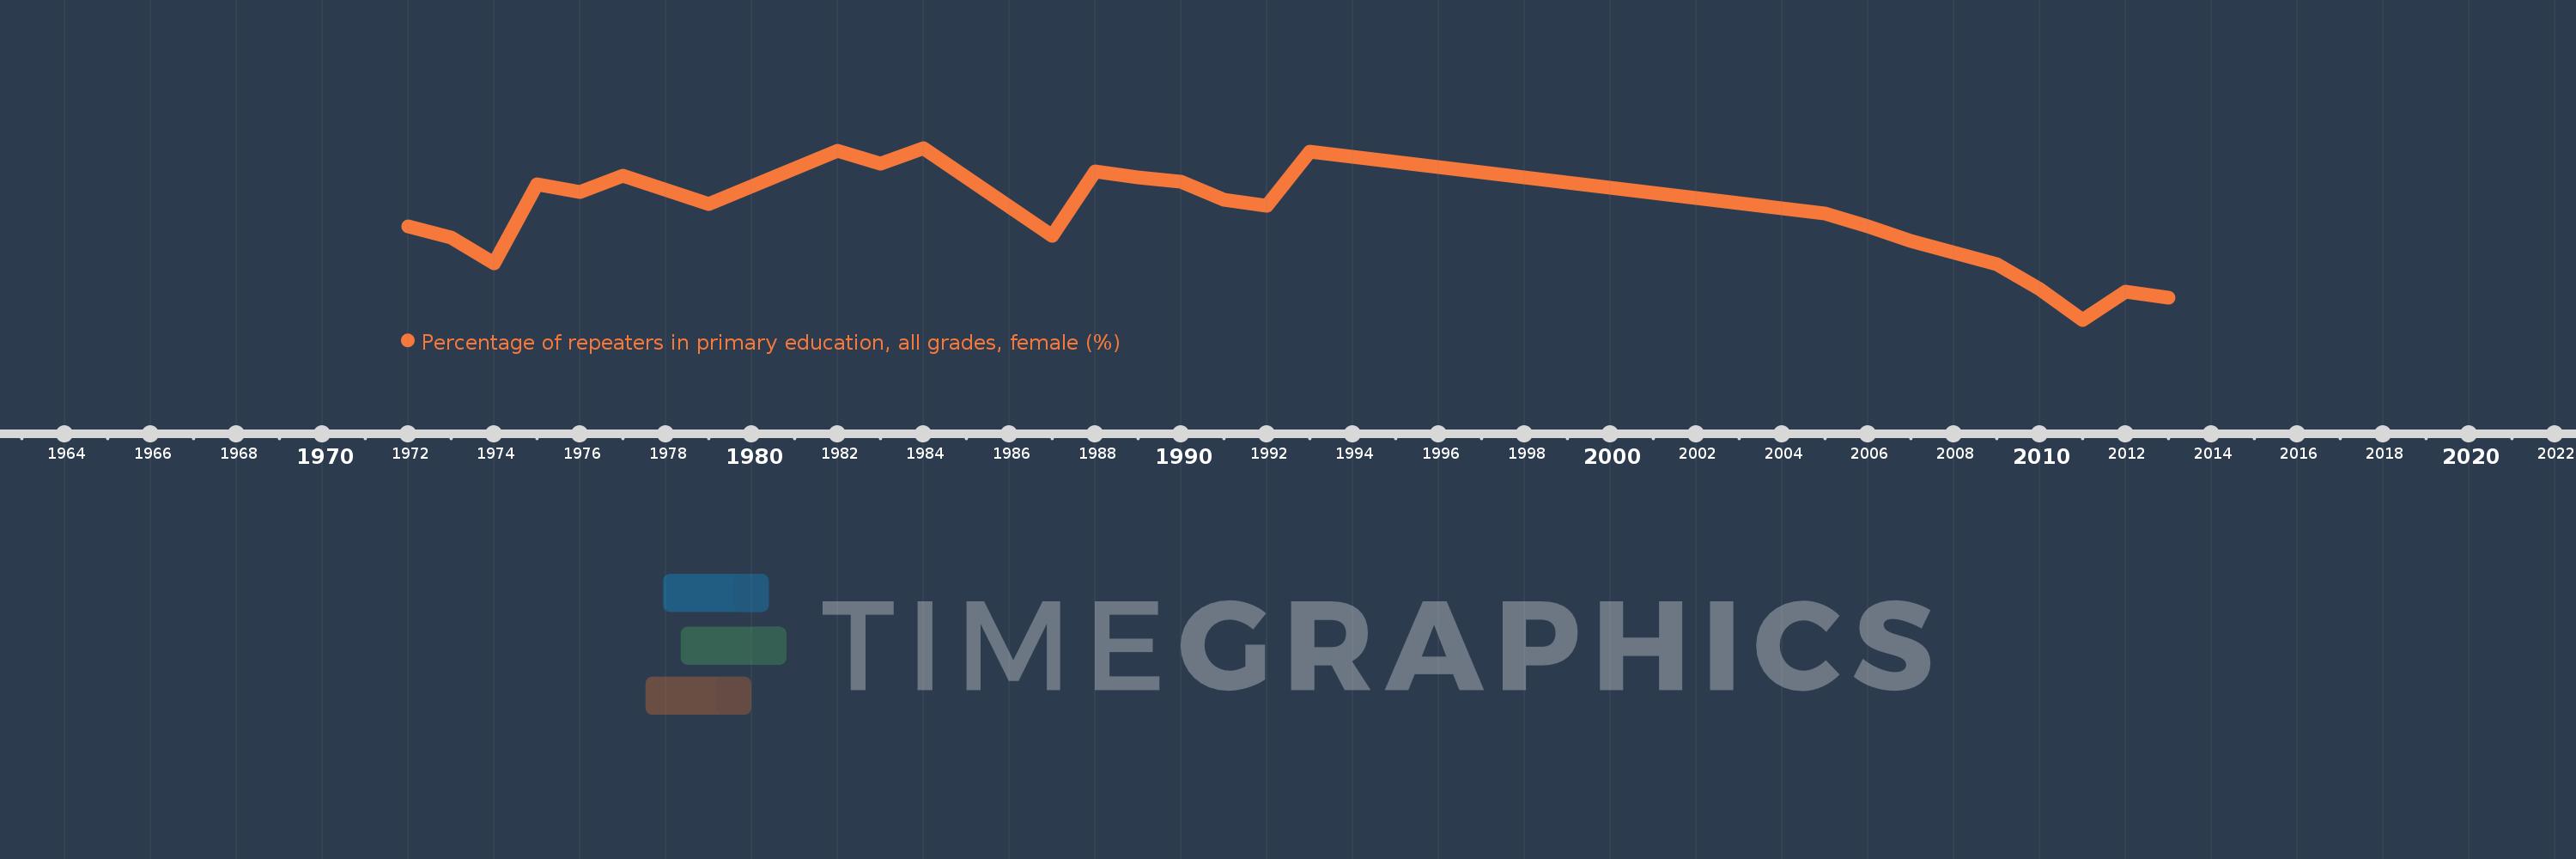
Percentage of repeaters in primary education, all grades, female (%)
2013,2012,2011,2010,2009,2007,2006,2005,1993,1992,1991,1990,1989,1988,1987,1984,1983,1982,1979,1977,1976,1975,1974,1973,1972
This statistics in other country:
AfghanistanAlbaniaAlgeriaAndorraAngolaAntigua and BarbudaArab WorldArgentinaArmeniaArubaAustriaAzerbaijanBahamas, TheBahrainBangladeshBelarusBelgiumBelizeBeninBermudaBhutanBoliviaBosnia and HerzegovinaBotswanaBrazilBritish Virgin IslandsBrunei DarussalamBulgariaBurkina FasoBurundiCabo VerdeCambodiaCameroonCanadaCaribbean small statesCayman IslandsCentral African RepublicCentral Europe and the BalticsChadChileChinaColombiaComorosCongo, Dem. Rep.Congo, Rep.Costa RicaCote d'IvoireCroatiaCubaCyprusCzech RepublicDenmarkDjiboutiDominicaDominican RepublicEarly-demographic dividendEast Asia & PacificEast Asia & Pacific (excluding high income)East Asia & Pacific (IDA & IBRD countries)EcuadorEgypt, Arab Rep.El SalvadorEquatorial GuineaEritreaEstoniaEthiopiaEuro areaEurope & Central AsiaEurope & Central Asia (excluding high income)Europe & Central Asia (IDA & IBRD countries)European UnionFijiFinlandFragile and conflict affected situationsFranceGabonGambia, TheGeorgiaGermanyGhanaGreeceGrenadaGuatemalaGuineaGuinea-BissauGuyanaHaitiHeavily indebted poor countries (HIPC)High incomeHondurasHong Kong SAR, ChinaHungaryIBRD onlyIcelandIDA & IBRD totalIDA blendIDA onlyIDA totalIndiaIndonesiaIran, Islamic Rep.IraqIrelandIsraelItalyJamaicaJapanJordanKazakhstanKenyaKiribatiKorea, Rep.KuwaitKyrgyz RepublicLao PDRLate-demographic dividendLatin America & Caribbean Latin America & Caribbean (excluding high income)Latin America & the Caribbean (IDA & IBRD countries)LatviaLeast developed countries: UN classificationLebanonLesothoLiberiaLibyaLiechtensteinLithuaniaLow & middle incomeLow incomeLower middle incomeLuxembourgMacao SAR, ChinaMacedonia, FYRMadagascarMalawiMalaysiaMaldivesMaliMaltaMauritaniaMauritiusMexicoMiddle East & North AfricaMiddle East & North Africa (excluding high income)Middle East & North Africa (IDA & IBRD countries)Middle incomeMoldovaMonacoMongoliaMontenegroMoroccoMozambiqueMyanmarNamibiaNauruNepalNetherlandsNew ZealandNicaraguaNigerNorwayOECD membersOmanOther small statesPacific island small statesPakistanPalauPanamaPapua New GuineaParaguayPeruPhilippinesPolandPortugalPost-demographic dividendPre-demographic dividendQatarRomaniaRussian FederationRwandaSamoaSan MarinoSao Tome and PrincipeSaudi ArabiaSenegalSerbiaSeychellesSierra LeoneSingaporeSint Maarten (Dutch part)Slovak RepublicSloveniaSmall statesSolomon IslandsSomaliaSouth AfricaSouth AsiaSouth Asia (IDA & IBRD)South SudanSpainSri LankaSt. Kitts and NevisSt. LuciaSt. Vincent and the GrenadinesSub-Saharan Africa Sub-Saharan Africa (excluding high income)Sub-Saharan Africa (IDA & IBRD countries)SudanSurinameSwazilandSwedenSwitzerlandSyrian Arab RepublicTajikistanTanzaniaThailandTimor-LesteTogoTongaTrinidad and TobagoTunisiaTurkeyTurks and Caicos IslandsTuvaluUgandaUkraineUnited Arab EmiratesUnited KingdomUpper middle incomeUruguayUzbekistanVanuatuVenezuela, RBVietnamWest Bank and GazaWorldYemen, Rep.ZambiaZimbabwe Timeline:
This timeline shows a graph from 1972 to 2013 of Central African Republic. No data until 1971. Number of actual observations by date: 25.
Source name:
World Development Indicators
Source organization:
UNESCO Institute for Statistics
Categories, topics:
Education, Gender
Last updated:
apr 23, 2017
Indicators value changes by year
Minimum:
20.871
jan 1, 2011
Maximum:
36.891
jan 1, 1984
At the date of observation
Value
Absolute change
Change from previous value
jan 1, 1972
29.572
+29.572
0.0%
jan 1, 1973
28.547
-1.026
-3.47%
jan 1, 1974
26.155
-2.392
-8.38%
jan 1, 1975
33.518
+7.363
28.15%
jan 1, 1976
32.762
-0.756
-2.25%
jan 1, 1977
34.329
+1.567
4.78%
jan 1, 1979
31.633
-2.696
-7.85%
jan 1, 1982
36.631
+4.998
15.8%
jan 1, 1983
35.451
-1.18
-3.22%
jan 1, 1984
36.891
+1.44
4.06%
jan 1, 1987
28.716
-8.175
-22.16%
jan 1, 1988
34.705
+5.989
20.86%
jan 1, 1989
34.119
-0.586
-1.69%
jan 1, 1990
33.714
-0.405
-1.19%
jan 1, 1991
32.031
-1.683
-4.99%
jan 1, 1992
31.518
-0.513
-1.6%
jan 1, 1993
36.513
+4.994
15.85%
jan 1, 2005
30.779
-5.733
-15.7%
jan 1, 2006
29.592
-1.187
-3.86%
jan 1, 2007
28.181
-1.411
-4.77%
jan 1, 2009
26.025
-2.156
-7.65%
jan 1, 2010
23.749
-2.276
-8.74%
jan 1, 2011
20.871
-2.878
-12.12%
jan 1, 2012
23.46
+2.589
12.4%
jan 1, 2013
22.911
-0.548
-2.34%
Ranking of countries by current statistics by years


Comments: