29
/
en
AIzaSyAYiBZKx7MnpbEhh9jyipgxe19OcubqV5w
April 1, 2024
185660
Madagascar
MDG
true
2
1
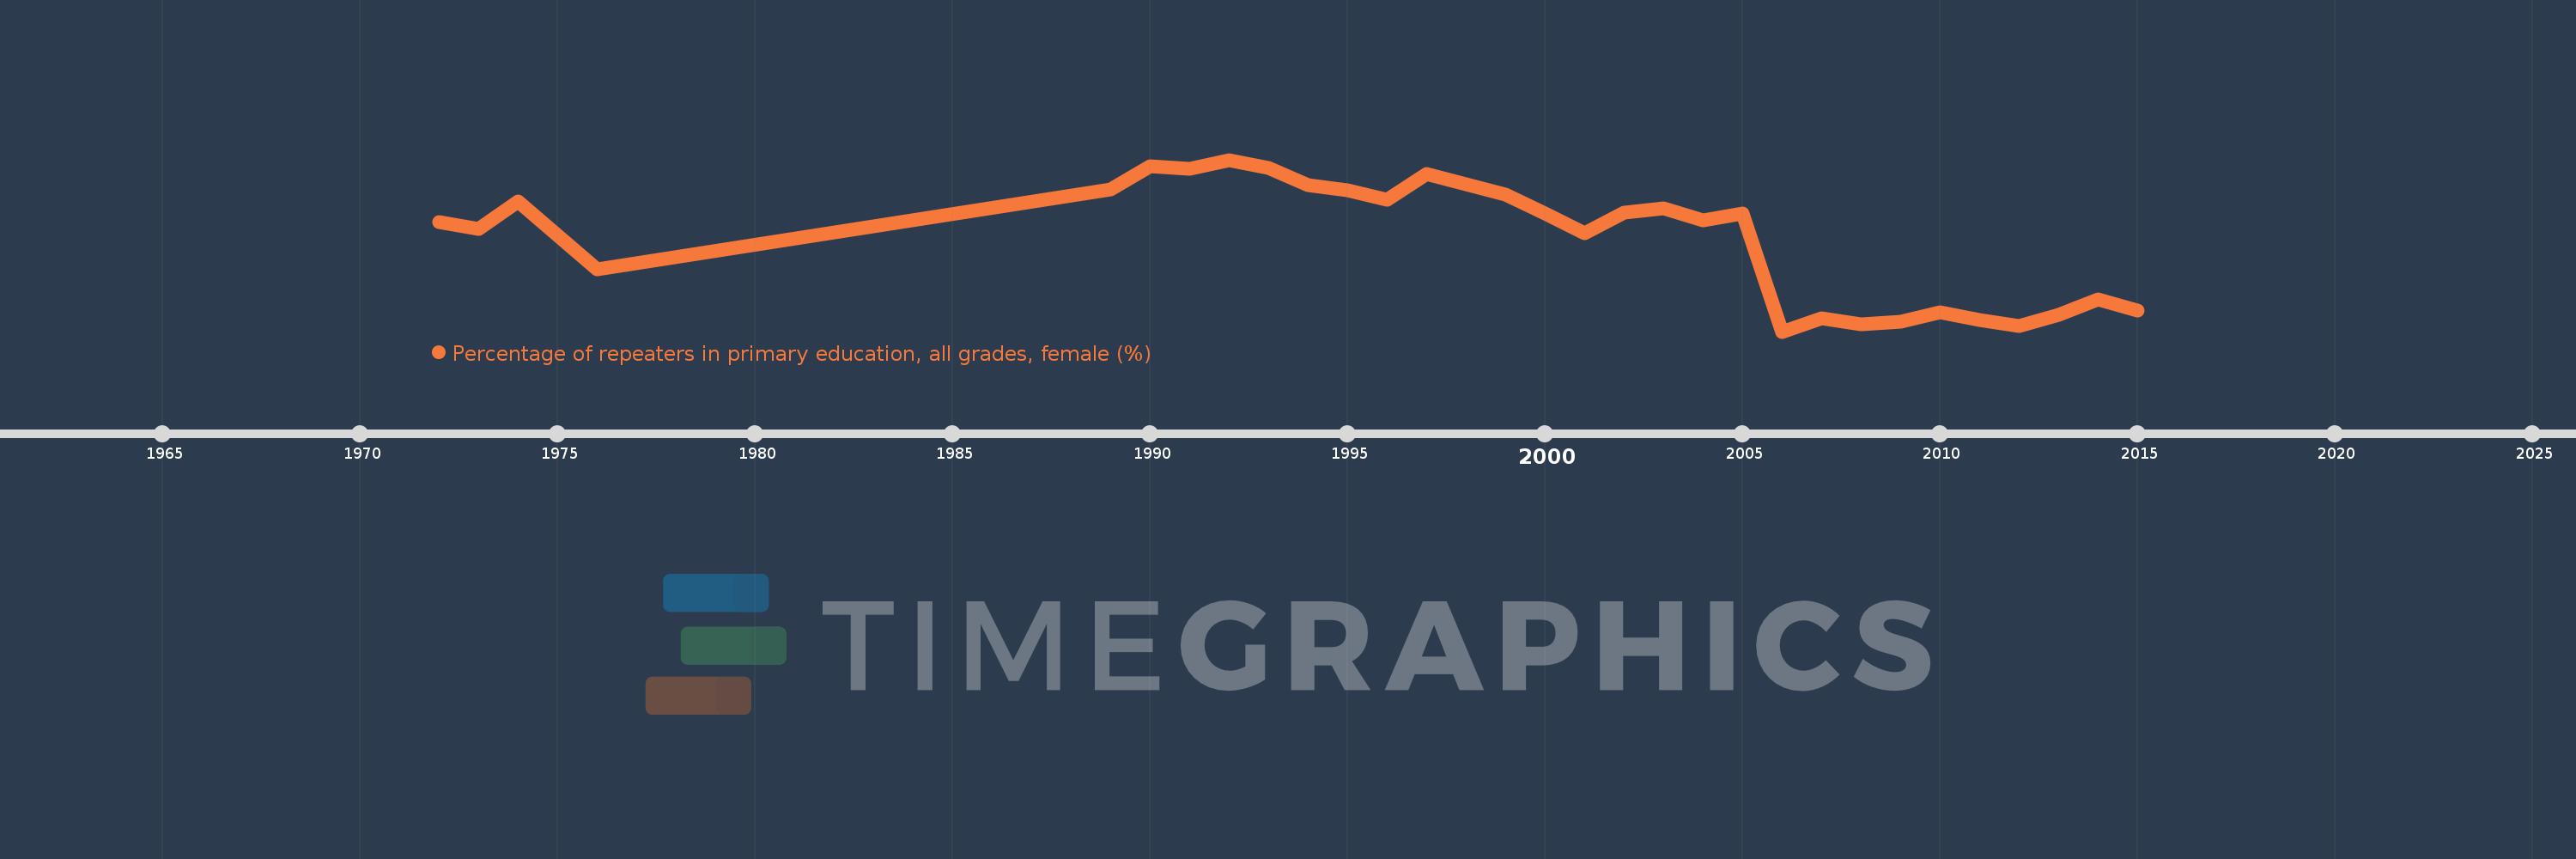
Percentage of repeaters in primary education, all grades, female (%)
2015,2014,2013,2012,2011,2010,2009,2008,2007,2006,2005,2004,2003,2002,2001,2000,1999,1997,1996,1995,1994,1993,1992,1991,1990,1989,1976,1974,1973,1972
This statistics in other country:
AfghanistanAlbaniaAlgeriaAndorraAngolaAntigua and BarbudaArab WorldArgentinaArmeniaArubaAustriaAzerbaijanBahamas, TheBahrainBangladeshBelarusBelgiumBelizeBeninBermudaBhutanBoliviaBosnia and HerzegovinaBotswanaBrazilBritish Virgin IslandsBrunei DarussalamBulgariaBurkina FasoBurundiCabo VerdeCambodiaCameroonCanadaCaribbean small statesCayman IslandsCentral African RepublicCentral Europe and the BalticsChadChileChinaColombiaComorosCongo, Dem. Rep.Congo, Rep.Costa RicaCote d'IvoireCroatiaCubaCyprusCzech RepublicDenmarkDjiboutiDominicaDominican RepublicEarly-demographic dividendEast Asia & PacificEast Asia & Pacific (excluding high income)East Asia & Pacific (IDA & IBRD countries)EcuadorEgypt, Arab Rep.El SalvadorEquatorial GuineaEritreaEstoniaEthiopiaEuro areaEurope & Central AsiaEurope & Central Asia (excluding high income)Europe & Central Asia (IDA & IBRD countries)European UnionFijiFinlandFragile and conflict affected situationsFranceGabonGambia, TheGeorgiaGermanyGhanaGreeceGrenadaGuatemalaGuineaGuinea-BissauGuyanaHaitiHeavily indebted poor countries (HIPC)High incomeHondurasHong Kong SAR, ChinaHungaryIBRD onlyIcelandIDA & IBRD totalIDA blendIDA onlyIDA totalIndiaIndonesiaIran, Islamic Rep.IraqIrelandIsraelItalyJamaicaJapanJordanKazakhstanKenyaKiribatiKorea, Rep.KuwaitKyrgyz RepublicLao PDRLate-demographic dividendLatin America & Caribbean Latin America & Caribbean (excluding high income)Latin America & the Caribbean (IDA & IBRD countries)LatviaLeast developed countries: UN classificationLebanonLesothoLiberiaLibyaLiechtensteinLithuaniaLow & middle incomeLow incomeLower middle incomeLuxembourgMacao SAR, ChinaMacedonia, FYRMadagascarMalawiMalaysiaMaldivesMaliMaltaMauritaniaMauritiusMexicoMiddle East & North AfricaMiddle East & North Africa (excluding high income)Middle East & North Africa (IDA & IBRD countries)Middle incomeMoldovaMonacoMongoliaMontenegroMoroccoMozambiqueMyanmarNamibiaNauruNepalNetherlandsNew ZealandNicaraguaNigerNorwayOECD membersOmanOther small statesPacific island small statesPakistanPalauPanamaPapua New GuineaParaguayPeruPhilippinesPolandPortugalPost-demographic dividendPre-demographic dividendQatarRomaniaRussian FederationRwandaSamoaSan MarinoSao Tome and PrincipeSaudi ArabiaSenegalSerbiaSeychellesSierra LeoneSingaporeSint Maarten (Dutch part)Slovak RepublicSloveniaSmall statesSolomon IslandsSomaliaSouth AfricaSouth AsiaSouth Asia (IDA & IBRD)South SudanSpainSri LankaSt. Kitts and NevisSt. LuciaSt. Vincent and the GrenadinesSub-Saharan Africa Sub-Saharan Africa (excluding high income)Sub-Saharan Africa (IDA & IBRD countries)SudanSurinameSwazilandSwedenSwitzerlandSyrian Arab RepublicTajikistanTanzaniaThailandTimor-LesteTogoTongaTrinidad and TobagoTunisiaTurkeyTurks and Caicos IslandsTuvaluUgandaUkraineUnited Arab EmiratesUnited KingdomUpper middle incomeUruguayUzbekistanVanuatuVenezuela, RBVietnamWest Bank and GazaWorldYemen, Rep.ZambiaZimbabwe Timeline:
This timeline shows a graph from 1972 to 2015 of Madagascar. No data until 1971. Number of actual observations by date: 30.
Source name:
World Development Indicators
Source organization:
UNESCO Institute for Statistics
Categories, topics:
Education, Gender
Last updated:
apr 23, 2017
Indicators value changes by year
Minimum:
17.738
jan 1, 2006
Maximum:
34.063
jan 1, 1992
At the date of observation
Value
Absolute change
Change from previous value
jan 1, 1972
28.142
+28.142
0.0%
jan 1, 1973
27.532
-0.61
-2.17%
jan 1, 1974
30.112
+2.58
9.37%
jan 1, 1976
23.657
-6.455
-21.44%
jan 1, 1989
31.253
+7.596
32.11%
jan 1, 1990
33.425
+2.172
6.95%
jan 1, 1991
33.235
-0.19
-0.57%
jan 1, 1992
34.063
+0.828
2.49%
jan 1, 1993
33.26
-0.803
-2.36%
jan 1, 1994
31.662
-1.598
-4.8%
jan 1, 1995
31.173
-0.488
-1.54%
jan 1, 1996
30.298
-0.876
-2.81%
jan 1, 1997
32.742
+2.445
8.07%
jan 1, 1999
30.769
-1.973
-6.03%
jan 1, 2000
28.928
-1.841
-5.98%
jan 1, 2001
27.05
-1.878
-6.49%
jan 1, 2002
29.004
+1.953
7.22%
jan 1, 2003
29.421
+0.418
1.44%
jan 1, 2004
28.292
-1.129
-3.84%
jan 1, 2005
28.979
+0.686
2.43%
jan 1, 2006
17.738
-11.241
-38.79%
jan 1, 2007
19.039
+1.301
7.34%
jan 1, 2008
18.419
-0.62
-3.25%
jan 1, 2009
18.715
+0.295
1.6%
jan 1, 2010
19.608
+0.893
4.77%
jan 1, 2011
18.804
-0.804
-4.1%
jan 1, 2012
18.285
-0.52
-2.76%
jan 1, 2013
19.33
+1.045
5.72%
jan 1, 2014
20.838
+1.508
7.8%
jan 1, 2015
19.709
-1.129
-5.42%
Ranking of countries by current statistics by years


Comments: