29
/
en
AIzaSyAYiBZKx7MnpbEhh9jyipgxe19OcubqV5w
April 1, 2024
52939
OECD members
OED
false
2
1
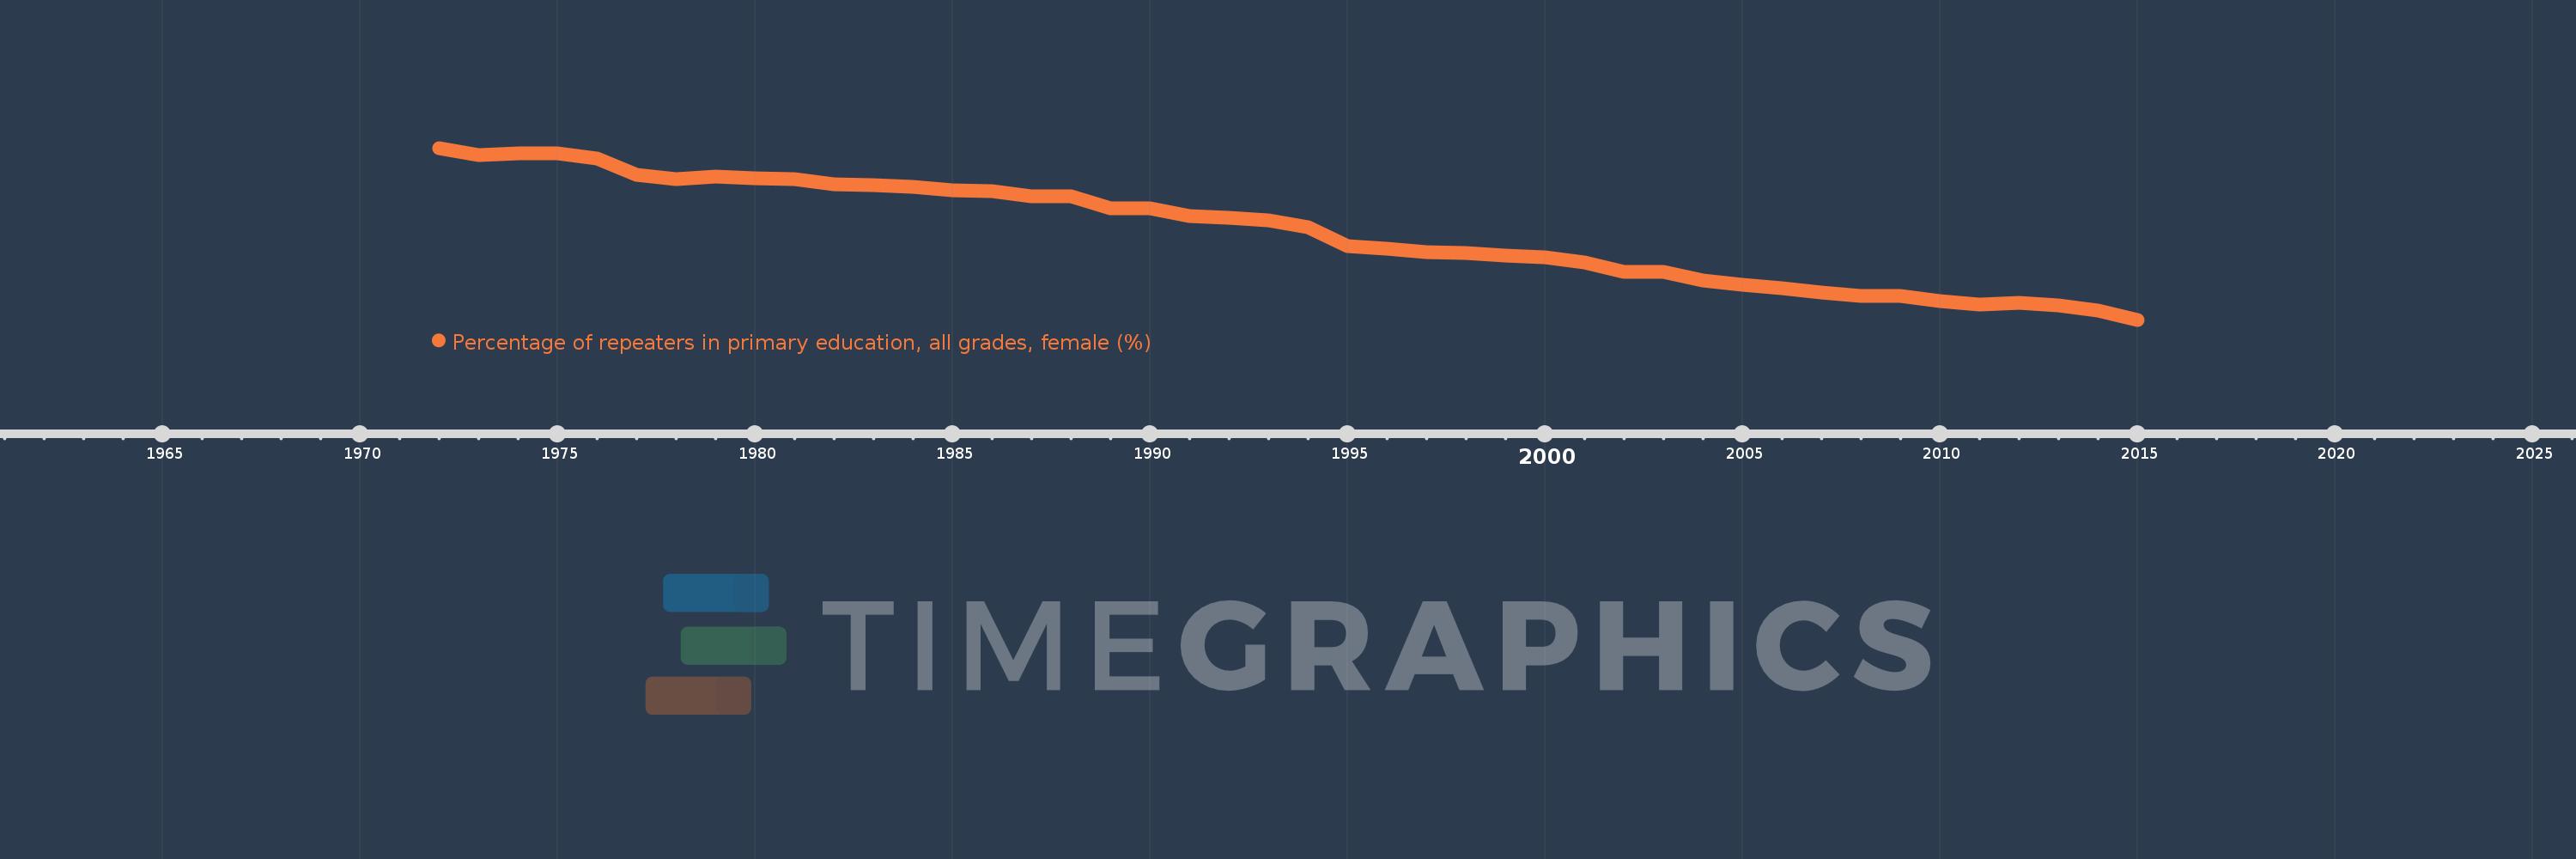
Percentage of repeaters in primary education, all grades, female (%)
2015,2014,2013,2012,2011,2010,2009,2008,2007,2006,2005,2004,2003,2002,2001,2000,1999,1998,1997,1996,1995,1994,1993,1992,1991,1990,1989,1988,1987,1986,1985,1984,1983,1982,1981,1980,1979,1978,1977,1976,1975,1974,1973,1972
This statistics in other country:
AfghanistanAlbaniaAlgeriaAndorraAngolaAntigua and BarbudaArab WorldArgentinaArmeniaArubaAustriaAzerbaijanBahamas, TheBahrainBangladeshBelarusBelgiumBelizeBeninBermudaBhutanBoliviaBosnia and HerzegovinaBotswanaBrazilBritish Virgin IslandsBrunei DarussalamBulgariaBurkina FasoBurundiCabo VerdeCambodiaCameroonCanadaCaribbean small statesCayman IslandsCentral African RepublicCentral Europe and the BalticsChadChileChinaColombiaComorosCongo, Dem. Rep.Congo, Rep.Costa RicaCote d'IvoireCroatiaCubaCyprusCzech RepublicDenmarkDjiboutiDominicaDominican RepublicEarly-demographic dividendEast Asia & PacificEast Asia & Pacific (excluding high income)East Asia & Pacific (IDA & IBRD countries)EcuadorEgypt, Arab Rep.El SalvadorEquatorial GuineaEritreaEstoniaEthiopiaEuro areaEurope & Central AsiaEurope & Central Asia (excluding high income)Europe & Central Asia (IDA & IBRD countries)European UnionFijiFinlandFragile and conflict affected situationsFranceGabonGambia, TheGeorgiaGermanyGhanaGreeceGrenadaGuatemalaGuineaGuinea-BissauGuyanaHaitiHeavily indebted poor countries (HIPC)High incomeHondurasHong Kong SAR, ChinaHungaryIBRD onlyIcelandIDA & IBRD totalIDA blendIDA onlyIDA totalIndiaIndonesiaIran, Islamic Rep.IraqIrelandIsraelItalyJamaicaJapanJordanKazakhstanKenyaKiribatiKorea, Rep.KuwaitKyrgyz RepublicLao PDRLate-demographic dividendLatin America & Caribbean Latin America & Caribbean (excluding high income)Latin America & the Caribbean (IDA & IBRD countries)LatviaLeast developed countries: UN classificationLebanonLesothoLiberiaLibyaLiechtensteinLithuaniaLow & middle incomeLow incomeLower middle incomeLuxembourgMacao SAR, ChinaMacedonia, FYRMadagascarMalawiMalaysiaMaldivesMaliMaltaMauritaniaMauritiusMexicoMiddle East & North AfricaMiddle East & North Africa (excluding high income)Middle East & North Africa (IDA & IBRD countries)Middle incomeMoldovaMonacoMongoliaMontenegroMoroccoMozambiqueMyanmarNamibiaNauruNepalNetherlandsNew ZealandNicaraguaNigerNorwayOECD membersOmanOther small statesPacific island small statesPakistanPalauPanamaPapua New GuineaParaguayPeruPhilippinesPolandPortugalPost-demographic dividendPre-demographic dividendQatarRomaniaRussian FederationRwandaSamoaSan MarinoSao Tome and PrincipeSaudi ArabiaSenegalSerbiaSeychellesSierra LeoneSingaporeSint Maarten (Dutch part)Slovak RepublicSloveniaSmall statesSolomon IslandsSomaliaSouth AfricaSouth AsiaSouth Asia (IDA & IBRD)South SudanSpainSri LankaSt. Kitts and NevisSt. LuciaSt. Vincent and the GrenadinesSub-Saharan Africa Sub-Saharan Africa (excluding high income)Sub-Saharan Africa (IDA & IBRD countries)SudanSurinameSwazilandSwedenSwitzerlandSyrian Arab RepublicTajikistanTanzaniaThailandTimor-LesteTogoTongaTrinidad and TobagoTunisiaTurkeyTurks and Caicos IslandsTuvaluUgandaUkraineUnited Arab EmiratesUnited KingdomUpper middle incomeUruguayUzbekistanVanuatuVenezuela, RBVietnamWest Bank and GazaWorldYemen, Rep.ZambiaZimbabwe Timeline:
This timeline shows a graph from 1972 to 2015 of OECD members. No data until 1971. Number of actual observations by date: 44.
Source name:
World Development Indicators
Source organization:
UNESCO Institute for Statistics
Categories, topics:
Education, Gender
Last updated:
apr 23, 2017
Indicators value changes by year
At the date of observation
Value
Absolute change
Change from previous value
jan 1, 1972
4.422
+4.422
0.0%
jan 1, 1973
4.305
-0.117
-2.65%
jan 1, 1974
4.34
+0.035
0.82%
jan 1, 1975
4.341
+0.001
0.03%
jan 1, 1976
4.257
-0.085
-1.96%
jan 1, 1977
3.992
-0.264
-6.21%
jan 1, 1978
3.912
-0.08
-2.0%
jan 1, 1979
3.954
+0.042
1.07%
jan 1, 1980
3.934
-0.02
-0.51%
jan 1, 1981
3.912
-0.022
-0.57%
jan 1, 1982
3.829
-0.083
-2.11%
jan 1, 1983
3.817
-0.012
-0.3%
jan 1, 1984
3.796
-0.021
-0.55%
jan 1, 1985
3.729
-0.067
-1.77%
jan 1, 1986
3.722
-0.007
-0.18%
jan 1, 1987
3.635
-0.087
-2.33%
jan 1, 1988
3.64
+0.004
0.12%
jan 1, 1989
3.447
-0.193
-5.3%
jan 1, 1990
3.441
-0.005
-0.16%
jan 1, 1991
3.321
-0.121
-3.51%
jan 1, 1992
3.294
-0.026
-0.79%
jan 1, 1993
3.253
-0.041
-1.25%
jan 1, 1994
3.14
-0.113
-3.48%
jan 1, 1995
2.825
-0.315
-10.02%
jan 1, 1996
2.793
-0.032
-1.13%
jan 1, 1997
2.731
-0.063
-2.24%
jan 1, 1998
2.719
-0.012
-0.43%
jan 1, 1999
2.679
-0.04
-1.46%
jan 1, 2000
2.656
-0.023
-0.86%
jan 1, 2001
2.563
-0.093
-3.51%
jan 1, 2002
2.414
-0.149
-5.8%
jan 1, 2003
2.413
-0.001
-0.04%
jan 1, 2004
2.281
-0.132
-5.47%
jan 1, 2005
2.209
-0.073
-3.18%
jan 1, 2006
2.15
-0.058
-2.64%
jan 1, 2007
2.075
-0.076
-3.53%
jan 1, 2008
2.018
-0.057
-2.73%
jan 1, 2009
2.024
+0.006
0.3%
jan 1, 2010
1.944
-0.08
-3.95%
jan 1, 2011
1.888
-0.056
-2.89%
jan 1, 2012
1.915
+0.027
1.42%
jan 1, 2013
1.869
-0.046
-2.38%
jan 1, 2014
1.783
-0.086
-4.6%
jan 1, 2015
1.638
-0.145
-8.14%
Ranking of countries by current statistics by years


Comments: