29
/
en
AIzaSyAYiBZKx7MnpbEhh9jyipgxe19OcubqV5w
April 1, 2024
48442
Middle East & North Africa
MEA
false
2
1
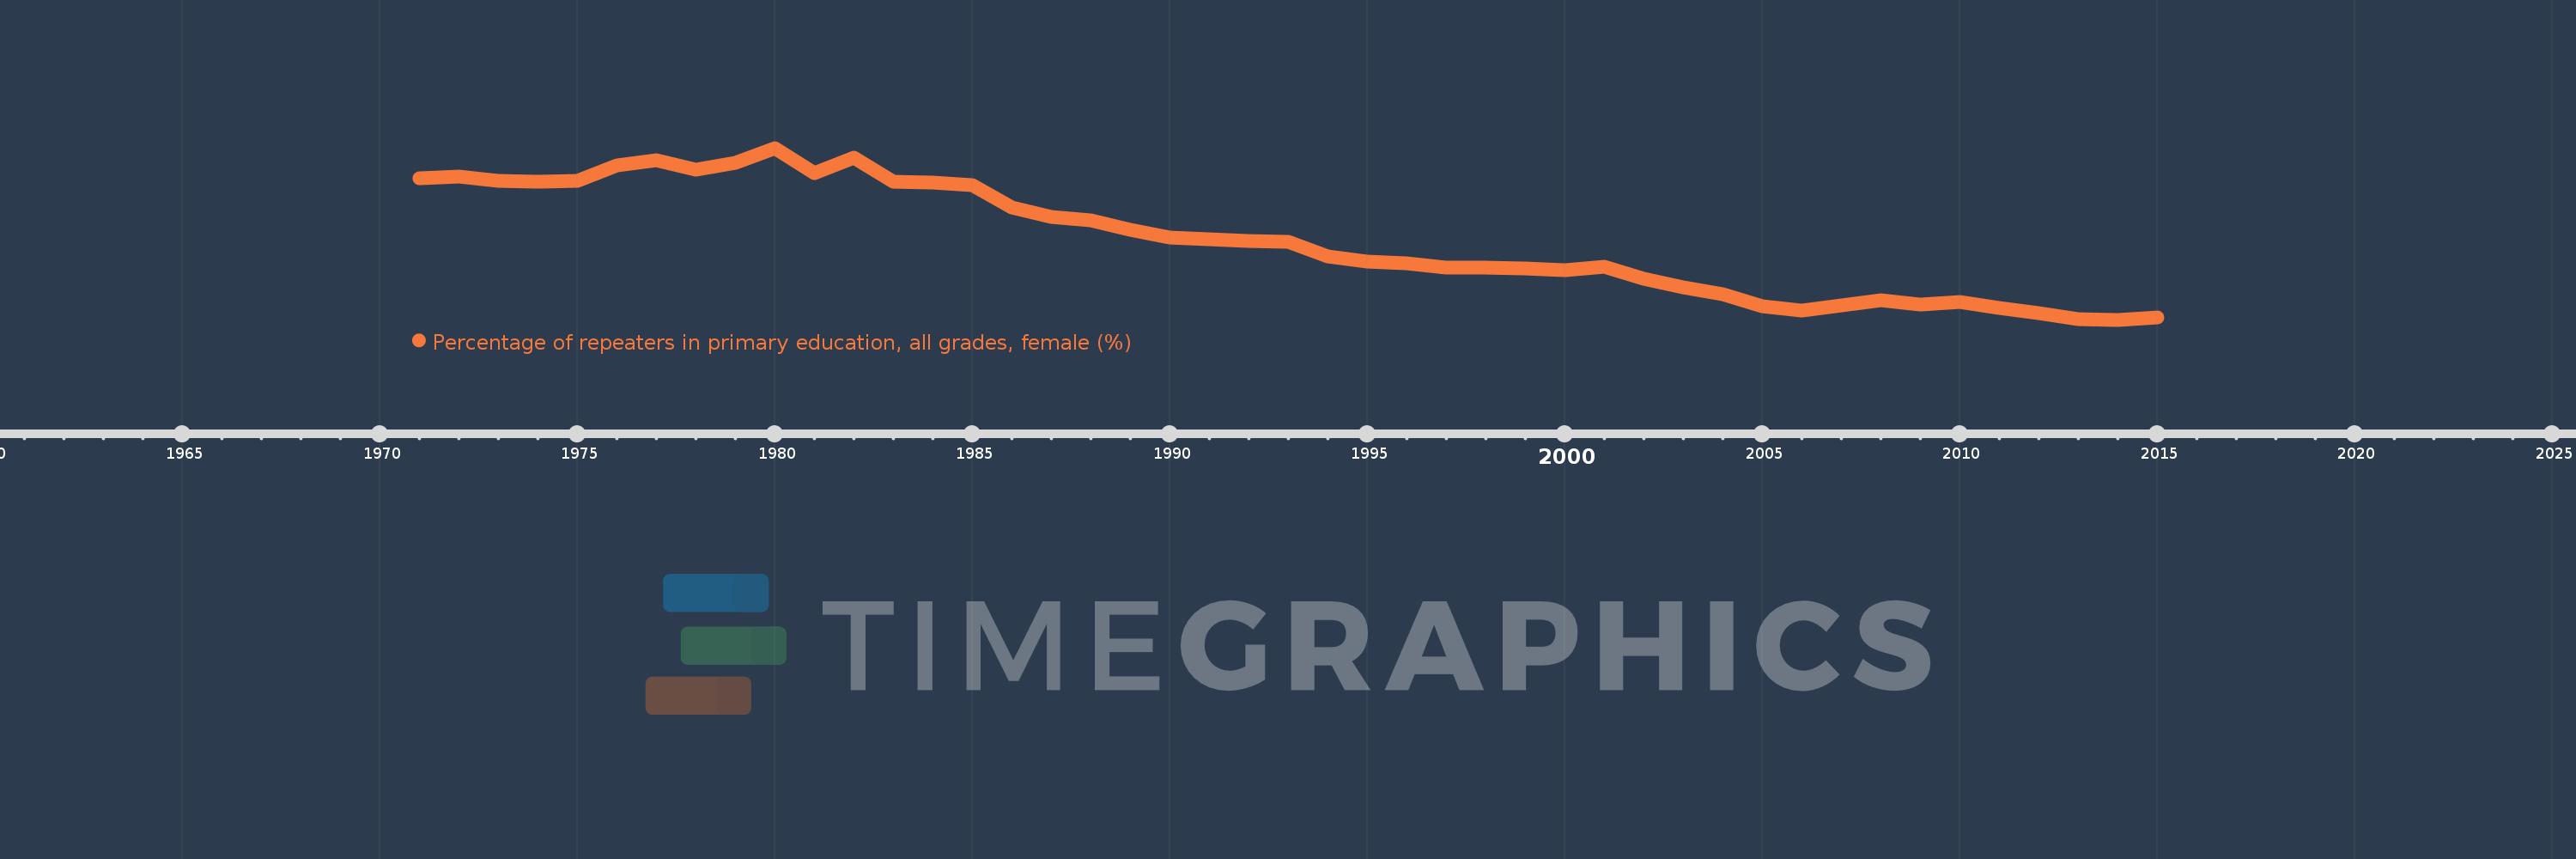
Percentage of repeaters in primary education, all grades, female (%)
2015,2014,2013,2012,2011,2010,2009,2008,2007,2006,2005,2004,2003,2002,2001,2000,1999,1998,1997,1996,1995,1994,1993,1992,1991,1990,1989,1988,1987,1986,1985,1984,1983,1982,1981,1980,1979,1978,1977,1976,1975,1974,1973,1972,1971
This statistics in other country:
AfghanistanAlbaniaAlgeriaAndorraAngolaAntigua and BarbudaArab WorldArgentinaArmeniaArubaAustriaAzerbaijanBahamas, TheBahrainBangladeshBelarusBelgiumBelizeBeninBermudaBhutanBoliviaBosnia and HerzegovinaBotswanaBrazilBritish Virgin IslandsBrunei DarussalamBulgariaBurkina FasoBurundiCabo VerdeCambodiaCameroonCanadaCaribbean small statesCayman IslandsCentral African RepublicCentral Europe and the BalticsChadChileChinaColombiaComorosCongo, Dem. Rep.Congo, Rep.Costa RicaCote d'IvoireCroatiaCubaCyprusCzech RepublicDenmarkDjiboutiDominicaDominican RepublicEarly-demographic dividendEast Asia & PacificEast Asia & Pacific (excluding high income)East Asia & Pacific (IDA & IBRD countries)EcuadorEgypt, Arab Rep.El SalvadorEquatorial GuineaEritreaEstoniaEthiopiaEuro areaEurope & Central AsiaEurope & Central Asia (excluding high income)Europe & Central Asia (IDA & IBRD countries)European UnionFijiFinlandFragile and conflict affected situationsFranceGabonGambia, TheGeorgiaGermanyGhanaGreeceGrenadaGuatemalaGuineaGuinea-BissauGuyanaHaitiHeavily indebted poor countries (HIPC)High incomeHondurasHong Kong SAR, ChinaHungaryIBRD onlyIcelandIDA & IBRD totalIDA blendIDA onlyIDA totalIndiaIndonesiaIran, Islamic Rep.IraqIrelandIsraelItalyJamaicaJapanJordanKazakhstanKenyaKiribatiKorea, Rep.KuwaitKyrgyz RepublicLao PDRLate-demographic dividendLatin America & Caribbean Latin America & Caribbean (excluding high income)Latin America & the Caribbean (IDA & IBRD countries)LatviaLeast developed countries: UN classificationLebanonLesothoLiberiaLibyaLiechtensteinLithuaniaLow & middle incomeLow incomeLower middle incomeLuxembourgMacao SAR, ChinaMacedonia, FYRMadagascarMalawiMalaysiaMaldivesMaliMaltaMauritaniaMauritiusMexicoMiddle East & North AfricaMiddle East & North Africa (excluding high income)Middle East & North Africa (IDA & IBRD countries)Middle incomeMoldovaMonacoMongoliaMontenegroMoroccoMozambiqueMyanmarNamibiaNauruNepalNetherlandsNew ZealandNicaraguaNigerNorwayOECD membersOmanOther small statesPacific island small statesPakistanPalauPanamaPapua New GuineaParaguayPeruPhilippinesPolandPortugalPost-demographic dividendPre-demographic dividendQatarRomaniaRussian FederationRwandaSamoaSan MarinoSao Tome and PrincipeSaudi ArabiaSenegalSerbiaSeychellesSierra LeoneSingaporeSint Maarten (Dutch part)Slovak RepublicSloveniaSmall statesSolomon IslandsSomaliaSouth AfricaSouth AsiaSouth Asia (IDA & IBRD)South SudanSpainSri LankaSt. Kitts and NevisSt. LuciaSt. Vincent and the GrenadinesSub-Saharan Africa Sub-Saharan Africa (excluding high income)Sub-Saharan Africa (IDA & IBRD countries)SudanSurinameSwazilandSwedenSwitzerlandSyrian Arab RepublicTajikistanTanzaniaThailandTimor-LesteTogoTongaTrinidad and TobagoTunisiaTurkeyTurks and Caicos IslandsTuvaluUgandaUkraineUnited Arab EmiratesUnited KingdomUpper middle incomeUruguayUzbekistanVanuatuVenezuela, RBVietnamWest Bank and GazaWorldYemen, Rep.ZambiaZimbabwe Timeline:
This timeline shows a graph from 1971 to 2015 of Middle East & North Africa. No data until 1970. Number of actual observations by date: 45.
Source name:
World Development Indicators
Source organization:
UNESCO Institute for Statistics
Categories, topics:
Education, Gender
Last updated:
apr 23, 2017
Indicators value changes by year
Maximum:
11.343
jan 1, 1980
At the date of observation
Value
Absolute change
Change from previous value
jan 1, 1971
10.159
+10.159
0.0%
jan 1, 1972
10.221
+0.062
0.61%
jan 1, 1973
10.058
-0.163
-1.6%
jan 1, 1974
10.025
-0.033
-0.33%
jan 1, 1975
10.049
+0.024
0.24%
jan 1, 1976
10.66
+0.612
6.09%
jan 1, 1977
10.871
+0.21
1.97%
jan 1, 1978
10.49
-0.381
-3.5%
jan 1, 1979
10.754
+0.264
2.52%
jan 1, 1980
11.343
+0.589
5.48%
jan 1, 1981
10.351
-0.993
-8.75%
jan 1, 1982
10.959
+0.608
5.88%
jan 1, 1983
10.002
-0.957
-8.73%
jan 1, 1984
9.965
-0.037
-0.37%
jan 1, 1985
9.889
-0.076
-0.76%
jan 1, 1986
9.004
-0.885
-8.95%
jan 1, 1987
8.612
-0.393
-4.36%
jan 1, 1988
8.5
-0.112
-1.3%
jan 1, 1989
8.11
-0.39
-4.59%
jan 1, 1990
7.829
-0.281
-3.46%
jan 1, 1991
7.75
-0.079
-1.01%
jan 1, 1992
7.684
-0.066
-0.85%
jan 1, 1993
7.642
-0.042
-0.55%
jan 1, 1994
7.067
-0.575
-7.52%
jan 1, 1995
6.874
-0.194
-2.74%
jan 1, 1996
6.789
-0.085
-1.24%
jan 1, 1997
6.64
-0.149
-2.19%
jan 1, 1998
6.642
+0.002
0.03%
jan 1, 1999
6.594
-0.048
-0.72%
jan 1, 2000
6.528
-0.066
-1.0%
jan 1, 2001
6.664
+0.136
2.08%
jan 1, 2002
6.19
-0.474
-7.11%
jan 1, 2003
5.838
-0.352
-5.69%
jan 1, 2004
5.563
-0.275
-4.72%
jan 1, 2005
5.104
-0.459
-8.25%
jan 1, 2006
4.926
-0.178
-3.48%
jan 1, 2007
5.126
+0.2
4.05%
jan 1, 2008
5.35
+0.225
4.38%
jan 1, 2009
5.165
-0.186
-3.47%
jan 1, 2010
5.275
+0.11
2.14%
jan 1, 2011
5.02
-0.255
-4.83%
jan 1, 2012
4.826
-0.194
-3.87%
jan 1, 2013
4.589
-0.237
-4.91%
jan 1, 2014
4.573
-0.016
-0.34%
jan 1, 2015
4.663
+0.09
1.97%
Ranking of countries by current statistics by years


Comments: