29
/
en
AIzaSyAYiBZKx7MnpbEhh9jyipgxe19OcubqV5w
April 1, 2024
49378
Middle East & North Africa (excluding high income)
MNA
false
2
1
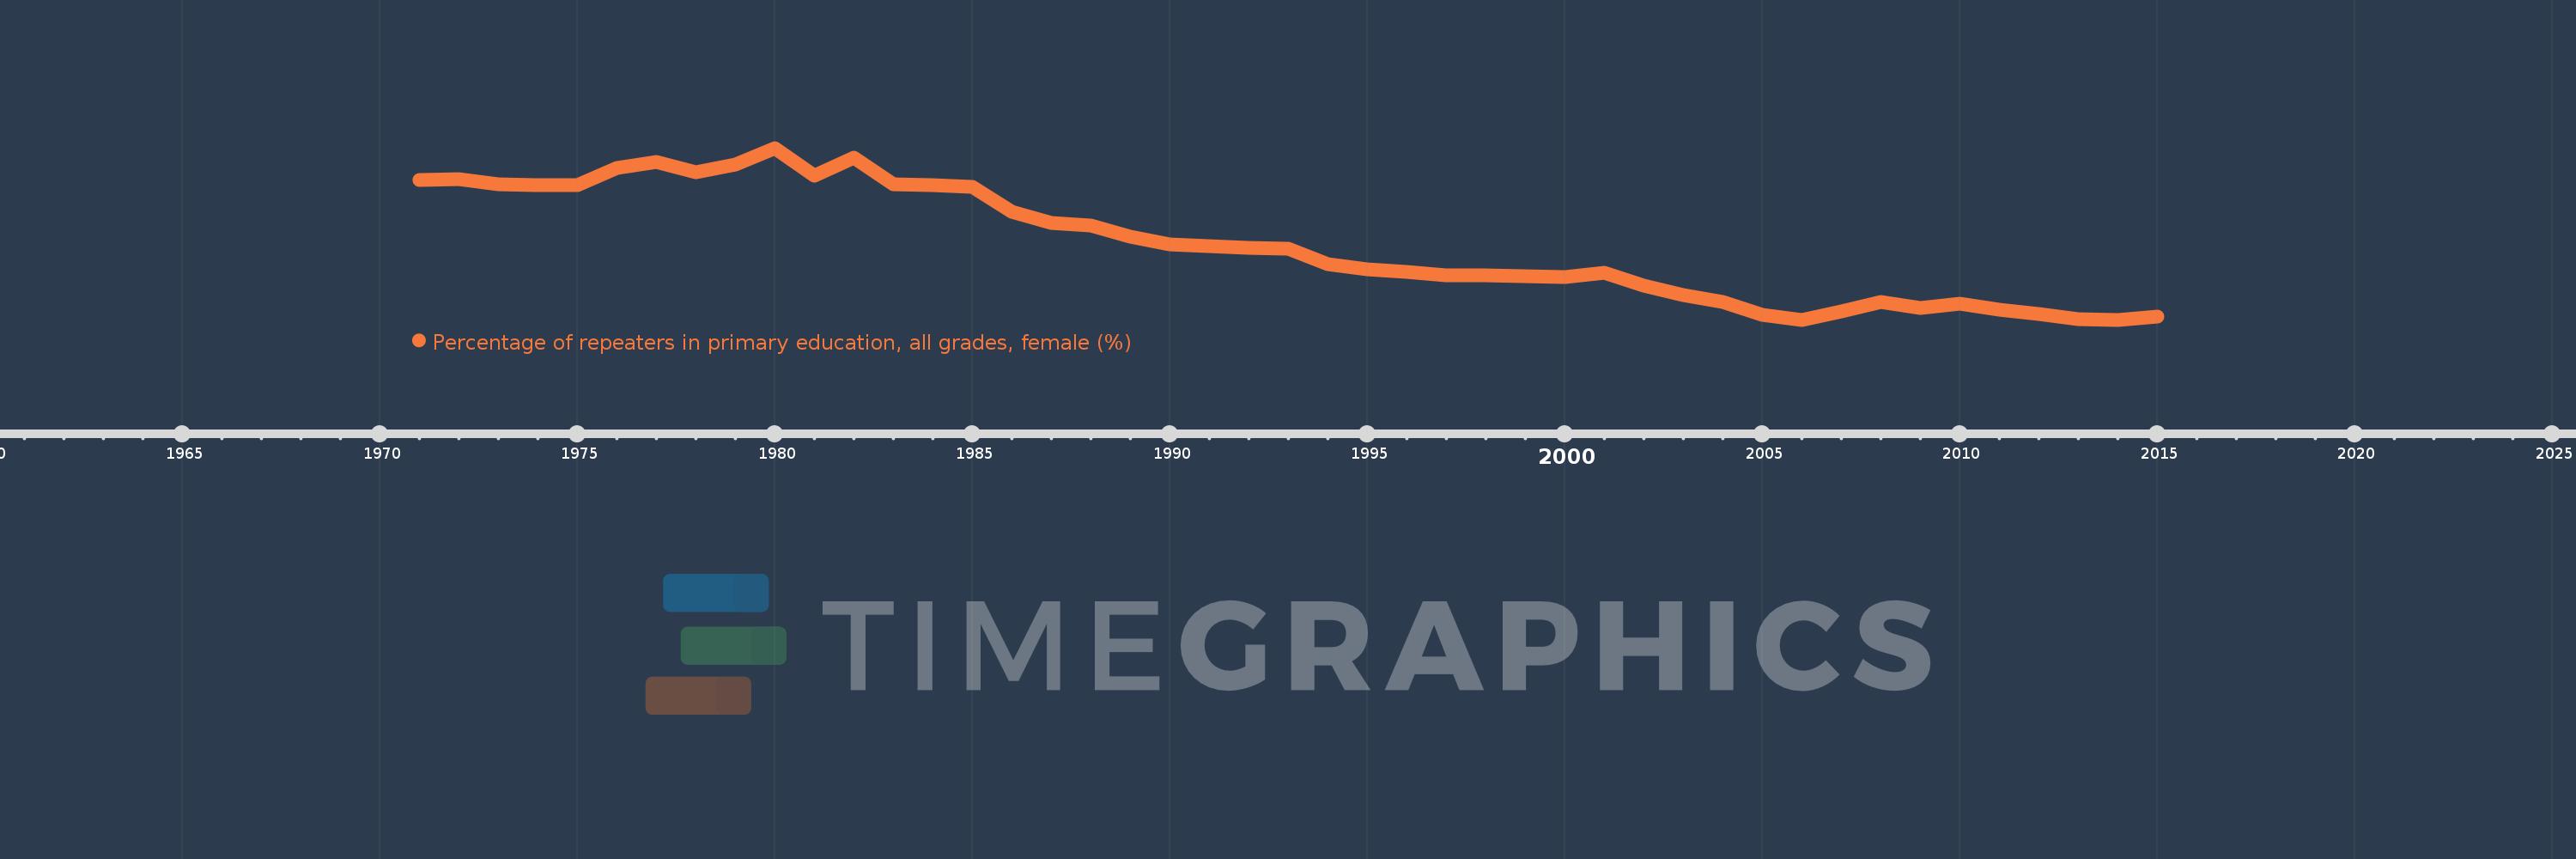
Percentage of repeaters in primary education, all grades, female (%)
2015,2014,2013,2012,2011,2010,2009,2008,2007,2006,2005,2004,2003,2002,2001,2000,1999,1998,1997,1996,1995,1994,1993,1992,1991,1990,1989,1988,1987,1986,1985,1984,1983,1982,1981,1980,1979,1978,1977,1976,1975,1974,1973,1972,1971
This statistics in other country:
AfghanistanAlbaniaAlgeriaAndorraAngolaAntigua and BarbudaArab WorldArgentinaArmeniaArubaAustriaAzerbaijanBahamas, TheBahrainBangladeshBelarusBelgiumBelizeBeninBermudaBhutanBoliviaBosnia and HerzegovinaBotswanaBrazilBritish Virgin IslandsBrunei DarussalamBulgariaBurkina FasoBurundiCabo VerdeCambodiaCameroonCanadaCaribbean small statesCayman IslandsCentral African RepublicCentral Europe and the BalticsChadChileChinaColombiaComorosCongo, Dem. Rep.Congo, Rep.Costa RicaCote d'IvoireCroatiaCubaCyprusCzech RepublicDenmarkDjiboutiDominicaDominican RepublicEarly-demographic dividendEast Asia & PacificEast Asia & Pacific (excluding high income)East Asia & Pacific (IDA & IBRD countries)EcuadorEgypt, Arab Rep.El SalvadorEquatorial GuineaEritreaEstoniaEthiopiaEuro areaEurope & Central AsiaEurope & Central Asia (excluding high income)Europe & Central Asia (IDA & IBRD countries)European UnionFijiFinlandFragile and conflict affected situationsFranceGabonGambia, TheGeorgiaGermanyGhanaGreeceGrenadaGuatemalaGuineaGuinea-BissauGuyanaHaitiHeavily indebted poor countries (HIPC)High incomeHondurasHong Kong SAR, ChinaHungaryIBRD onlyIcelandIDA & IBRD totalIDA blendIDA onlyIDA totalIndiaIndonesiaIran, Islamic Rep.IraqIrelandIsraelItalyJamaicaJapanJordanKazakhstanKenyaKiribatiKorea, Rep.KuwaitKyrgyz RepublicLao PDRLate-demographic dividendLatin America & Caribbean Latin America & Caribbean (excluding high income)Latin America & the Caribbean (IDA & IBRD countries)LatviaLeast developed countries: UN classificationLebanonLesothoLiberiaLibyaLiechtensteinLithuaniaLow & middle incomeLow incomeLower middle incomeLuxembourgMacao SAR, ChinaMacedonia, FYRMadagascarMalawiMalaysiaMaldivesMaliMaltaMauritaniaMauritiusMexicoMiddle East & North AfricaMiddle East & North Africa (excluding high income)Middle East & North Africa (IDA & IBRD countries)Middle incomeMoldovaMonacoMongoliaMontenegroMoroccoMozambiqueMyanmarNamibiaNauruNepalNetherlandsNew ZealandNicaraguaNigerNorwayOECD membersOmanOther small statesPacific island small statesPakistanPalauPanamaPapua New GuineaParaguayPeruPhilippinesPolandPortugalPost-demographic dividendPre-demographic dividendQatarRomaniaRussian FederationRwandaSamoaSan MarinoSao Tome and PrincipeSaudi ArabiaSenegalSerbiaSeychellesSierra LeoneSingaporeSint Maarten (Dutch part)Slovak RepublicSloveniaSmall statesSolomon IslandsSomaliaSouth AfricaSouth AsiaSouth Asia (IDA & IBRD)South SudanSpainSri LankaSt. Kitts and NevisSt. LuciaSt. Vincent and the GrenadinesSub-Saharan Africa Sub-Saharan Africa (excluding high income)Sub-Saharan Africa (IDA & IBRD countries)SudanSurinameSwazilandSwedenSwitzerlandSyrian Arab RepublicTajikistanTanzaniaThailandTimor-LesteTogoTongaTrinidad and TobagoTunisiaTurkeyTurks and Caicos IslandsTuvaluUgandaUkraineUnited Arab EmiratesUnited KingdomUpper middle incomeUruguayUzbekistanVanuatuVenezuela, RBVietnamWest Bank and GazaWorldYemen, Rep.ZambiaZimbabwe Timeline:
This timeline shows a graph from 1971 to 2015 of Middle East & North Africa (excluding high income). No data until 1970. Number of actual observations by date: 45.
Source name:
World Development Indicators
Source organization:
UNESCO Institute for Statistics
Categories, topics:
Education, Gender
Last updated:
apr 23, 2017
Indicators value changes by year
Maximum:
11.749
jan 1, 1980
At the date of observation
Value
Absolute change
Change from previous value
jan 1, 1971
10.488
+10.488
0.0%
jan 1, 1972
10.547
+0.059
0.57%
jan 1, 1973
10.346
-0.201
-1.91%
jan 1, 1974
10.303
-0.043
-0.42%
jan 1, 1975
10.31
+0.007
0.07%
jan 1, 1976
10.966
+0.656
6.36%
jan 1, 1977
11.197
+0.231
2.11%
jan 1, 1978
10.797
-0.4
-3.57%
jan 1, 1979
11.09
+0.293
2.72%
jan 1, 1980
11.749
+0.659
5.94%
jan 1, 1981
10.678
-1.071
-9.12%
jan 1, 1982
11.36
+0.683
6.39%
jan 1, 1983
10.342
-1.018
-8.96%
jan 1, 1984
10.31
-0.032
-0.31%
jan 1, 1985
10.235
-0.075
-0.73%
jan 1, 1986
9.277
-0.958
-9.36%
jan 1, 1987
8.847
-0.43
-4.64%
jan 1, 1988
8.721
-0.126
-1.42%
jan 1, 1989
8.296
-0.425
-4.87%
jan 1, 1990
8.002
-0.294
-3.55%
jan 1, 1991
7.935
-0.067
-0.84%
jan 1, 1992
7.87
-0.065
-0.82%
jan 1, 1993
7.845
-0.024
-0.31%
jan 1, 1994
7.226
-0.619
-7.89%
jan 1, 1995
7.02
-0.206
-2.85%
jan 1, 1996
6.945
-0.075
-1.07%
jan 1, 1997
6.794
-0.151
-2.17%
jan 1, 1998
6.807
+0.013
0.19%
jan 1, 1999
6.769
-0.038
-0.56%
jan 1, 2000
6.724
-0.045
-0.67%
jan 1, 2001
6.893
+0.169
2.52%
jan 1, 2002
6.387
-0.507
-7.35%
jan 1, 2003
6.024
-0.363
-5.68%
jan 1, 2004
5.758
-0.266
-4.41%
jan 1, 2005
5.26
-0.498
-8.65%
jan 1, 2006
5.077
-0.183
-3.49%
jan 1, 2007
5.407
+0.33
6.49%
jan 1, 2008
5.769
+0.362
6.7%
jan 1, 2009
5.537
-0.232
-4.02%
jan 1, 2010
5.703
+0.166
3.0%
jan 1, 2011
5.458
-0.244
-4.29%
jan 1, 2012
5.292
-0.166
-3.04%
jan 1, 2013
5.085
-0.207
-3.91%
jan 1, 2014
5.074
-0.011
-0.23%
jan 1, 2015
5.207
+0.133
2.63%
Ranking of countries by current statistics by years


Comments: