29
/
en
AIzaSyAYiBZKx7MnpbEhh9jyipgxe19OcubqV5w
April 1, 2024
35276
Heavily indebted poor countries (HIPC)
HPC
false
2
1
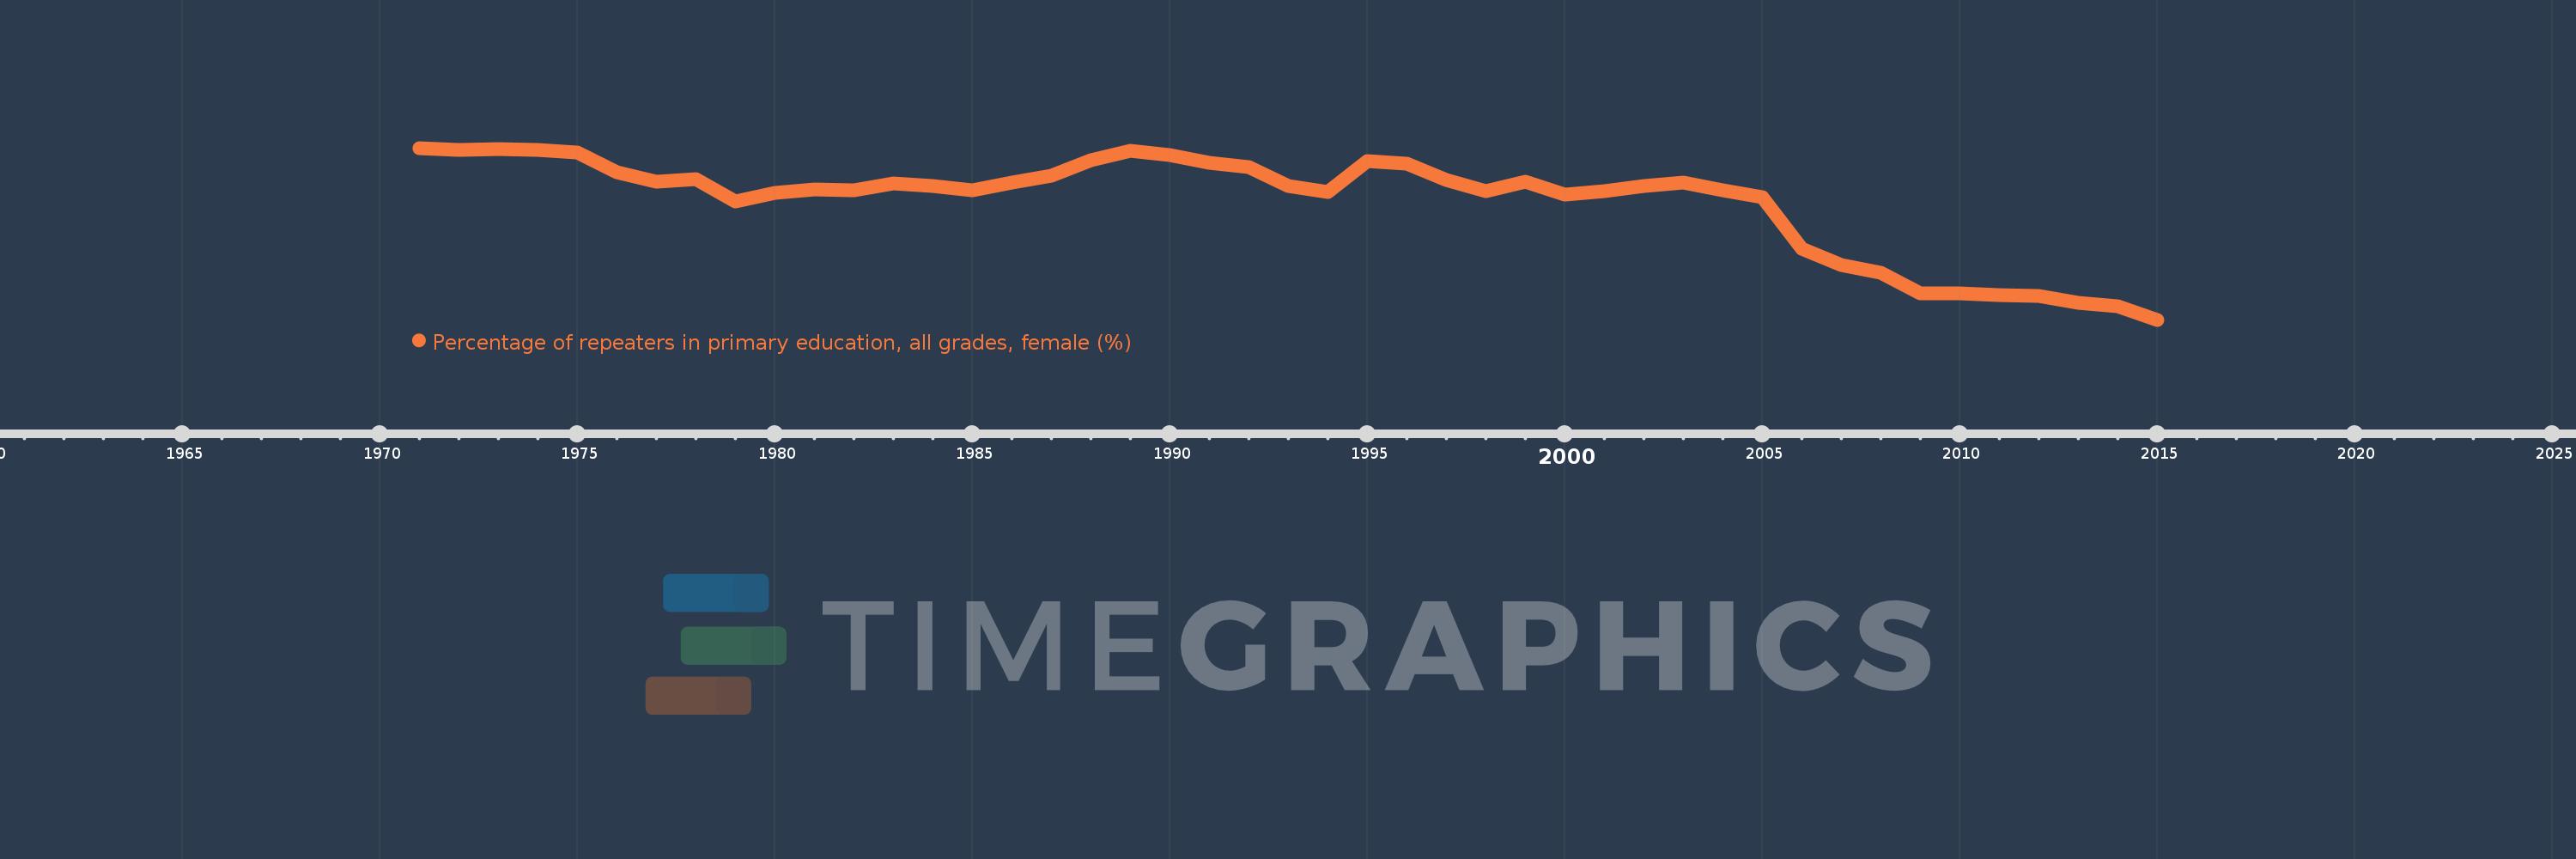
Percentage of repeaters in primary education, all grades, female (%)
2015,2014,2013,2012,2011,2010,2009,2008,2007,2006,2005,2004,2003,2002,2001,2000,1999,1998,1997,1996,1995,1994,1993,1992,1991,1990,1989,1988,1987,1986,1985,1984,1983,1982,1981,1980,1979,1978,1977,1976,1975,1974,1973,1972,1971
This statistics in other country:
AfghanistanAlbaniaAlgeriaAndorraAngolaAntigua and BarbudaArab WorldArgentinaArmeniaArubaAustriaAzerbaijanBahamas, TheBahrainBangladeshBelarusBelgiumBelizeBeninBermudaBhutanBoliviaBosnia and HerzegovinaBotswanaBrazilBritish Virgin IslandsBrunei DarussalamBulgariaBurkina FasoBurundiCabo VerdeCambodiaCameroonCanadaCaribbean small statesCayman IslandsCentral African RepublicCentral Europe and the BalticsChadChileChinaColombiaComorosCongo, Dem. Rep.Congo, Rep.Costa RicaCote d'IvoireCroatiaCubaCyprusCzech RepublicDenmarkDjiboutiDominicaDominican RepublicEarly-demographic dividendEast Asia & PacificEast Asia & Pacific (excluding high income)East Asia & Pacific (IDA & IBRD countries)EcuadorEgypt, Arab Rep.El SalvadorEquatorial GuineaEritreaEstoniaEthiopiaEuro areaEurope & Central AsiaEurope & Central Asia (excluding high income)Europe & Central Asia (IDA & IBRD countries)European UnionFijiFinlandFragile and conflict affected situationsFranceGabonGambia, TheGeorgiaGermanyGhanaGreeceGrenadaGuatemalaGuineaGuinea-BissauGuyanaHaitiHeavily indebted poor countries (HIPC)High incomeHondurasHong Kong SAR, ChinaHungaryIBRD onlyIcelandIDA & IBRD totalIDA blendIDA onlyIDA totalIndiaIndonesiaIran, Islamic Rep.IraqIrelandIsraelItalyJamaicaJapanJordanKazakhstanKenyaKiribatiKorea, Rep.KuwaitKyrgyz RepublicLao PDRLate-demographic dividendLatin America & Caribbean Latin America & Caribbean (excluding high income)Latin America & the Caribbean (IDA & IBRD countries)LatviaLeast developed countries: UN classificationLebanonLesothoLiberiaLibyaLiechtensteinLithuaniaLow & middle incomeLow incomeLower middle incomeLuxembourgMacao SAR, ChinaMacedonia, FYRMadagascarMalawiMalaysiaMaldivesMaliMaltaMauritaniaMauritiusMexicoMiddle East & North AfricaMiddle East & North Africa (excluding high income)Middle East & North Africa (IDA & IBRD countries)Middle incomeMoldovaMonacoMongoliaMontenegroMoroccoMozambiqueMyanmarNamibiaNauruNepalNetherlandsNew ZealandNicaraguaNigerNorwayOECD membersOmanOther small statesPacific island small statesPakistanPalauPanamaPapua New GuineaParaguayPeruPhilippinesPolandPortugalPost-demographic dividendPre-demographic dividendQatarRomaniaRussian FederationRwandaSamoaSan MarinoSao Tome and PrincipeSaudi ArabiaSenegalSerbiaSeychellesSierra LeoneSingaporeSint Maarten (Dutch part)Slovak RepublicSloveniaSmall statesSolomon IslandsSomaliaSouth AfricaSouth AsiaSouth Asia (IDA & IBRD)South SudanSpainSri LankaSt. Kitts and NevisSt. LuciaSt. Vincent and the GrenadinesSub-Saharan Africa Sub-Saharan Africa (excluding high income)Sub-Saharan Africa (IDA & IBRD countries)SudanSurinameSwazilandSwedenSwitzerlandSyrian Arab RepublicTajikistanTanzaniaThailandTimor-LesteTogoTongaTrinidad and TobagoTunisiaTurkeyTurks and Caicos IslandsTuvaluUgandaUkraineUnited Arab EmiratesUnited KingdomUpper middle incomeUruguayUzbekistanVanuatuVenezuela, RBVietnamWest Bank and GazaWorldYemen, Rep.ZambiaZimbabwe Timeline:
This timeline shows a graph from 1971 to 2015 of Heavily indebted poor countries (HIPC). No data until 1970. Number of actual observations by date: 45.
Source name:
World Development Indicators
Source organization:
UNESCO Institute for Statistics
Categories, topics:
Education, Gender
Last updated:
apr 23, 2017
Indicators value changes by year
Maximum:
15.557
jan 1, 1971
At the date of observation
Value
Absolute change
Change from previous value
jan 1, 1971
15.557
+15.557
0.0%
jan 1, 1972
15.485
-0.072
-0.46%
jan 1, 1973
15.508
+0.024
0.15%
jan 1, 1974
15.488
-0.02
-0.13%
jan 1, 1975
15.41
-0.078
-0.51%
jan 1, 1976
14.751
-0.66
-4.28%
jan 1, 1977
14.424
-0.327
-2.22%
jan 1, 1978
14.525
+0.101
0.7%
jan 1, 1979
13.776
-0.748
-5.15%
jan 1, 1980
14.055
+0.279
2.03%
jan 1, 1981
14.187
+0.131
0.93%
jan 1, 1982
14.133
-0.054
-0.38%
jan 1, 1983
14.387
+0.254
1.8%
jan 1, 1984
14.285
-0.103
-0.71%
jan 1, 1985
14.149
-0.136
-0.95%
jan 1, 1986
14.403
+0.254
1.79%
jan 1, 1987
14.628
+0.225
1.56%
jan 1, 1988
15.155
+0.527
3.61%
jan 1, 1989
15.455
+0.3
1.98%
jan 1, 1990
15.319
-0.136
-0.88%
jan 1, 1991
15.061
-0.258
-1.69%
jan 1, 1992
14.909
-0.151
-1.0%
jan 1, 1993
14.289
-0.62
-4.16%
jan 1, 1994
14.097
-0.192
-1.35%
jan 1, 1995
15.114
+1.018
7.22%
jan 1, 1996
15.047
-0.068
-0.45%
jan 1, 1997
14.494
-0.552
-3.67%
jan 1, 1998
14.112
-0.383
-2.64%
jan 1, 1999
14.421
+0.309
2.19%
jan 1, 2000
13.998
-0.423
-2.93%
jan 1, 2001
14.129
+0.13
0.93%
jan 1, 2002
14.302
+0.173
1.23%
jan 1, 2003
14.393
+0.091
0.64%
jan 1, 2004
14.146
-0.247
-1.71%
jan 1, 2005
13.919
-0.228
-1.61%
jan 1, 2006
12.187
-1.732
-12.45%
jan 1, 2007
11.649
-0.538
-4.41%
jan 1, 2008
11.409
-0.24
-2.06%
jan 1, 2009
10.705
-0.704
-6.17%
jan 1, 2010
10.703
-0.002
-0.02%
jan 1, 2011
10.649
-0.054
-0.51%
jan 1, 2012
10.63
-0.019
-0.18%
jan 1, 2013
10.39
-0.24
-2.26%
jan 1, 2014
10.277
-0.113
-1.09%
jan 1, 2015
9.834
-0.443
-4.31%
Ranking of countries by current statistics by years


Comments: