29
/
en
AIzaSyAYiBZKx7MnpbEhh9jyipgxe19OcubqV5w
April 1, 2024
221312
Paraguay
PRY
true
2
1
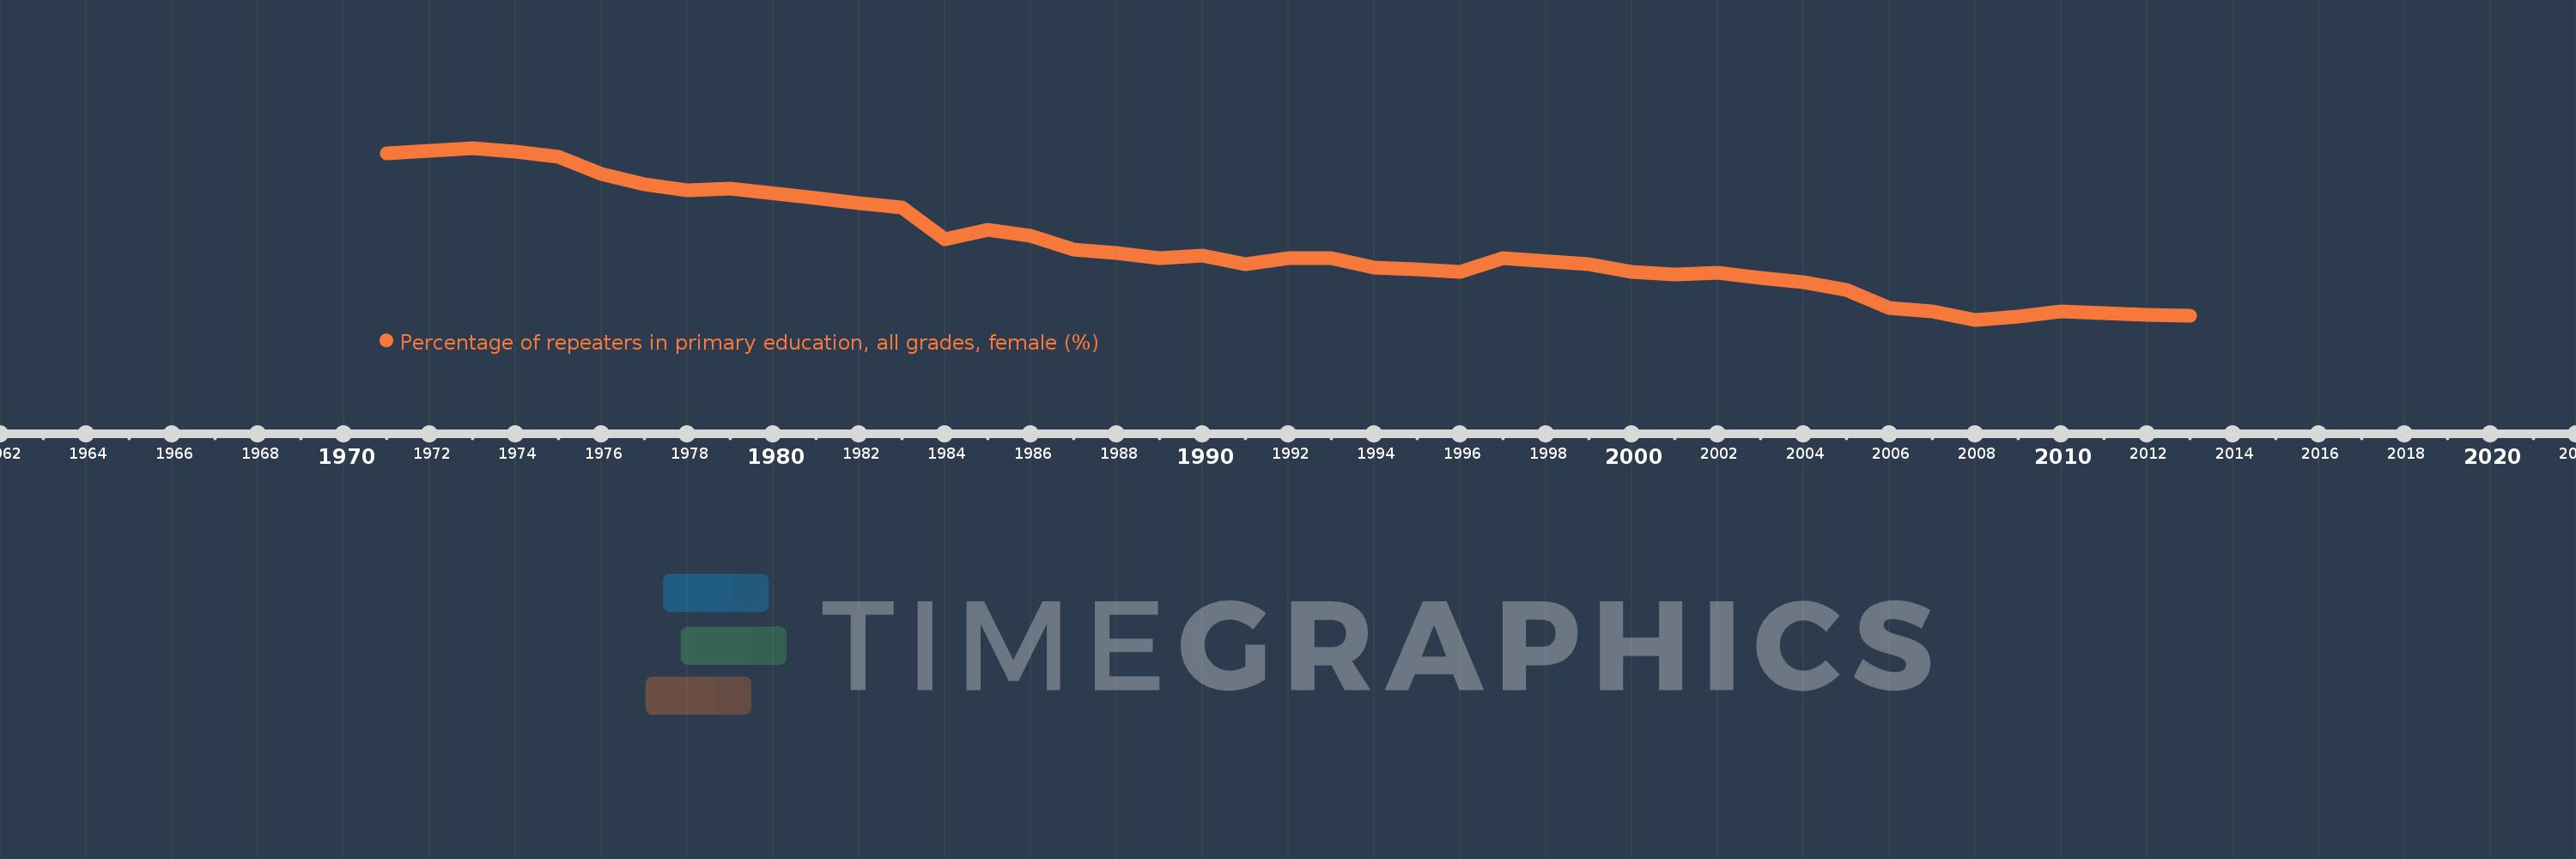
Percentage of repeaters in primary education, all grades, female (%)
2013,2012,2011,2010,2009,2008,2007,2006,2005,2004,2003,2002,2001,2000,1999,1997,1996,1995,1994,1993,1992,1991,1990,1989,1988,1987,1986,1985,1984,1983,1982,1981,1979,1978,1977,1976,1975,1974,1973,1971
This statistics in other country:
AfghanistanAlbaniaAlgeriaAndorraAngolaAntigua and BarbudaArab WorldArgentinaArmeniaArubaAustriaAzerbaijanBahamas, TheBahrainBangladeshBelarusBelgiumBelizeBeninBermudaBhutanBoliviaBosnia and HerzegovinaBotswanaBrazilBritish Virgin IslandsBrunei DarussalamBulgariaBurkina FasoBurundiCabo VerdeCambodiaCameroonCanadaCaribbean small statesCayman IslandsCentral African RepublicCentral Europe and the BalticsChadChileChinaColombiaComorosCongo, Dem. Rep.Congo, Rep.Costa RicaCote d'IvoireCroatiaCubaCyprusCzech RepublicDenmarkDjiboutiDominicaDominican RepublicEarly-demographic dividendEast Asia & PacificEast Asia & Pacific (excluding high income)East Asia & Pacific (IDA & IBRD countries)EcuadorEgypt, Arab Rep.El SalvadorEquatorial GuineaEritreaEstoniaEthiopiaEuro areaEurope & Central AsiaEurope & Central Asia (excluding high income)Europe & Central Asia (IDA & IBRD countries)European UnionFijiFinlandFragile and conflict affected situationsFranceGabonGambia, TheGeorgiaGermanyGhanaGreeceGrenadaGuatemalaGuineaGuinea-BissauGuyanaHaitiHeavily indebted poor countries (HIPC)High incomeHondurasHong Kong SAR, ChinaHungaryIBRD onlyIcelandIDA & IBRD totalIDA blendIDA onlyIDA totalIndiaIndonesiaIran, Islamic Rep.IraqIrelandIsraelItalyJamaicaJapanJordanKazakhstanKenyaKiribatiKorea, Rep.KuwaitKyrgyz RepublicLao PDRLate-demographic dividendLatin America & Caribbean Latin America & Caribbean (excluding high income)Latin America & the Caribbean (IDA & IBRD countries)LatviaLeast developed countries: UN classificationLebanonLesothoLiberiaLibyaLiechtensteinLithuaniaLow & middle incomeLow incomeLower middle incomeLuxembourgMacao SAR, ChinaMacedonia, FYRMadagascarMalawiMalaysiaMaldivesMaliMaltaMauritaniaMauritiusMexicoMiddle East & North AfricaMiddle East & North Africa (excluding high income)Middle East & North Africa (IDA & IBRD countries)Middle incomeMoldovaMonacoMongoliaMontenegroMoroccoMozambiqueMyanmarNamibiaNauruNepalNetherlandsNew ZealandNicaraguaNigerNorwayOECD membersOmanOther small statesPacific island small statesPakistanPalauPanamaPapua New GuineaParaguayPeruPhilippinesPolandPortugalPost-demographic dividendPre-demographic dividendQatarRomaniaRussian FederationRwandaSamoaSan MarinoSao Tome and PrincipeSaudi ArabiaSenegalSerbiaSeychellesSierra LeoneSingaporeSint Maarten (Dutch part)Slovak RepublicSloveniaSmall statesSolomon IslandsSomaliaSouth AfricaSouth AsiaSouth Asia (IDA & IBRD)South SudanSpainSri LankaSt. Kitts and NevisSt. LuciaSt. Vincent and the GrenadinesSub-Saharan Africa Sub-Saharan Africa (excluding high income)Sub-Saharan Africa (IDA & IBRD countries)SudanSurinameSwazilandSwedenSwitzerlandSyrian Arab RepublicTajikistanTanzaniaThailandTimor-LesteTogoTongaTrinidad and TobagoTunisiaTurkeyTurks and Caicos IslandsTuvaluUgandaUkraineUnited Arab EmiratesUnited KingdomUpper middle incomeUruguayUzbekistanVanuatuVenezuela, RBVietnamWest Bank and GazaWorldYemen, Rep.ZambiaZimbabwe Timeline:
This timeline shows a graph from 1971 to 2013 of Paraguay. No data until 1970. Number of actual observations by date: 40.
Source name:
World Development Indicators
Source organization:
UNESCO Institute for Statistics
Categories, topics:
Education, Gender
Last updated:
apr 23, 2017
Indicators value changes by year
Maximum:
15.709
jan 1, 1973
At the date of observation
Value
Absolute change
Change from previous value
jan 1, 1971
15.338
+15.338
0.0%
jan 1, 1973
15.709
+0.371
2.42%
jan 1, 1974
15.428
-0.281
-1.79%
jan 1, 1975
15.062
-0.367
-2.38%
jan 1, 1976
13.794
-1.268
-8.42%
jan 1, 1977
13.073
-0.721
-5.23%
jan 1, 1978
12.642
-0.431
-3.3%
jan 1, 1979
12.763
+0.121
0.96%
jan 1, 1981
12.082
-0.682
-5.34%
jan 1, 1982
11.697
-0.384
-3.18%
jan 1, 1983
11.372
-0.325
-2.78%
jan 1, 1984
9.105
-2.267
-19.94%
jan 1, 1985
9.769
+0.664
7.29%
jan 1, 1986
9.308
-0.46
-4.71%
jan 1, 1987
8.342
-0.967
-10.39%
jan 1, 1988
8.096
-0.245
-2.94%
jan 1, 1989
7.693
-0.403
-4.98%
jan 1, 1990
7.912
+0.219
2.84%
jan 1, 1991
7.297
-0.615
-7.77%
jan 1, 1992
7.699
+0.402
5.51%
jan 1, 1993
7.724
+0.025
0.33%
jan 1, 1994
7.019
-0.706
-9.14%
jan 1, 1995
6.926
-0.093
-1.33%
jan 1, 1996
6.729
-0.197
-2.84%
jan 1, 1997
7.737
+1.008
14.98%
jan 1, 1999
7.269
-0.468
-6.05%
jan 1, 2000
6.688
-0.581
-7.99%
jan 1, 2001
6.513
-0.175
-2.62%
jan 1, 2002
6.659
+0.146
2.25%
jan 1, 2003
6.28
-0.379
-5.69%
jan 1, 2004
5.974
-0.306
-4.88%
jan 1, 2005
5.377
-0.596
-9.98%
jan 1, 2006
4.072
-1.306
-24.28%
jan 1, 2007
3.825
-0.247
-6.05%
jan 1, 2008
3.24
-0.585
-15.3%
jan 1, 2009
3.483
+0.243
7.51%
jan 1, 2010
3.871
+0.388
11.14%
jan 1, 2011
3.7
-0.172
-4.43%
jan 1, 2012
3.574
-0.126
-3.4%
jan 1, 2013
3.518
-0.055
-1.55%
Ranking of countries by current statistics by years


Comments: