29
/
en
AIzaSyAYiBZKx7MnpbEhh9jyipgxe19OcubqV5w
April 1, 2024
46465
Low income
LIC
false
2
1
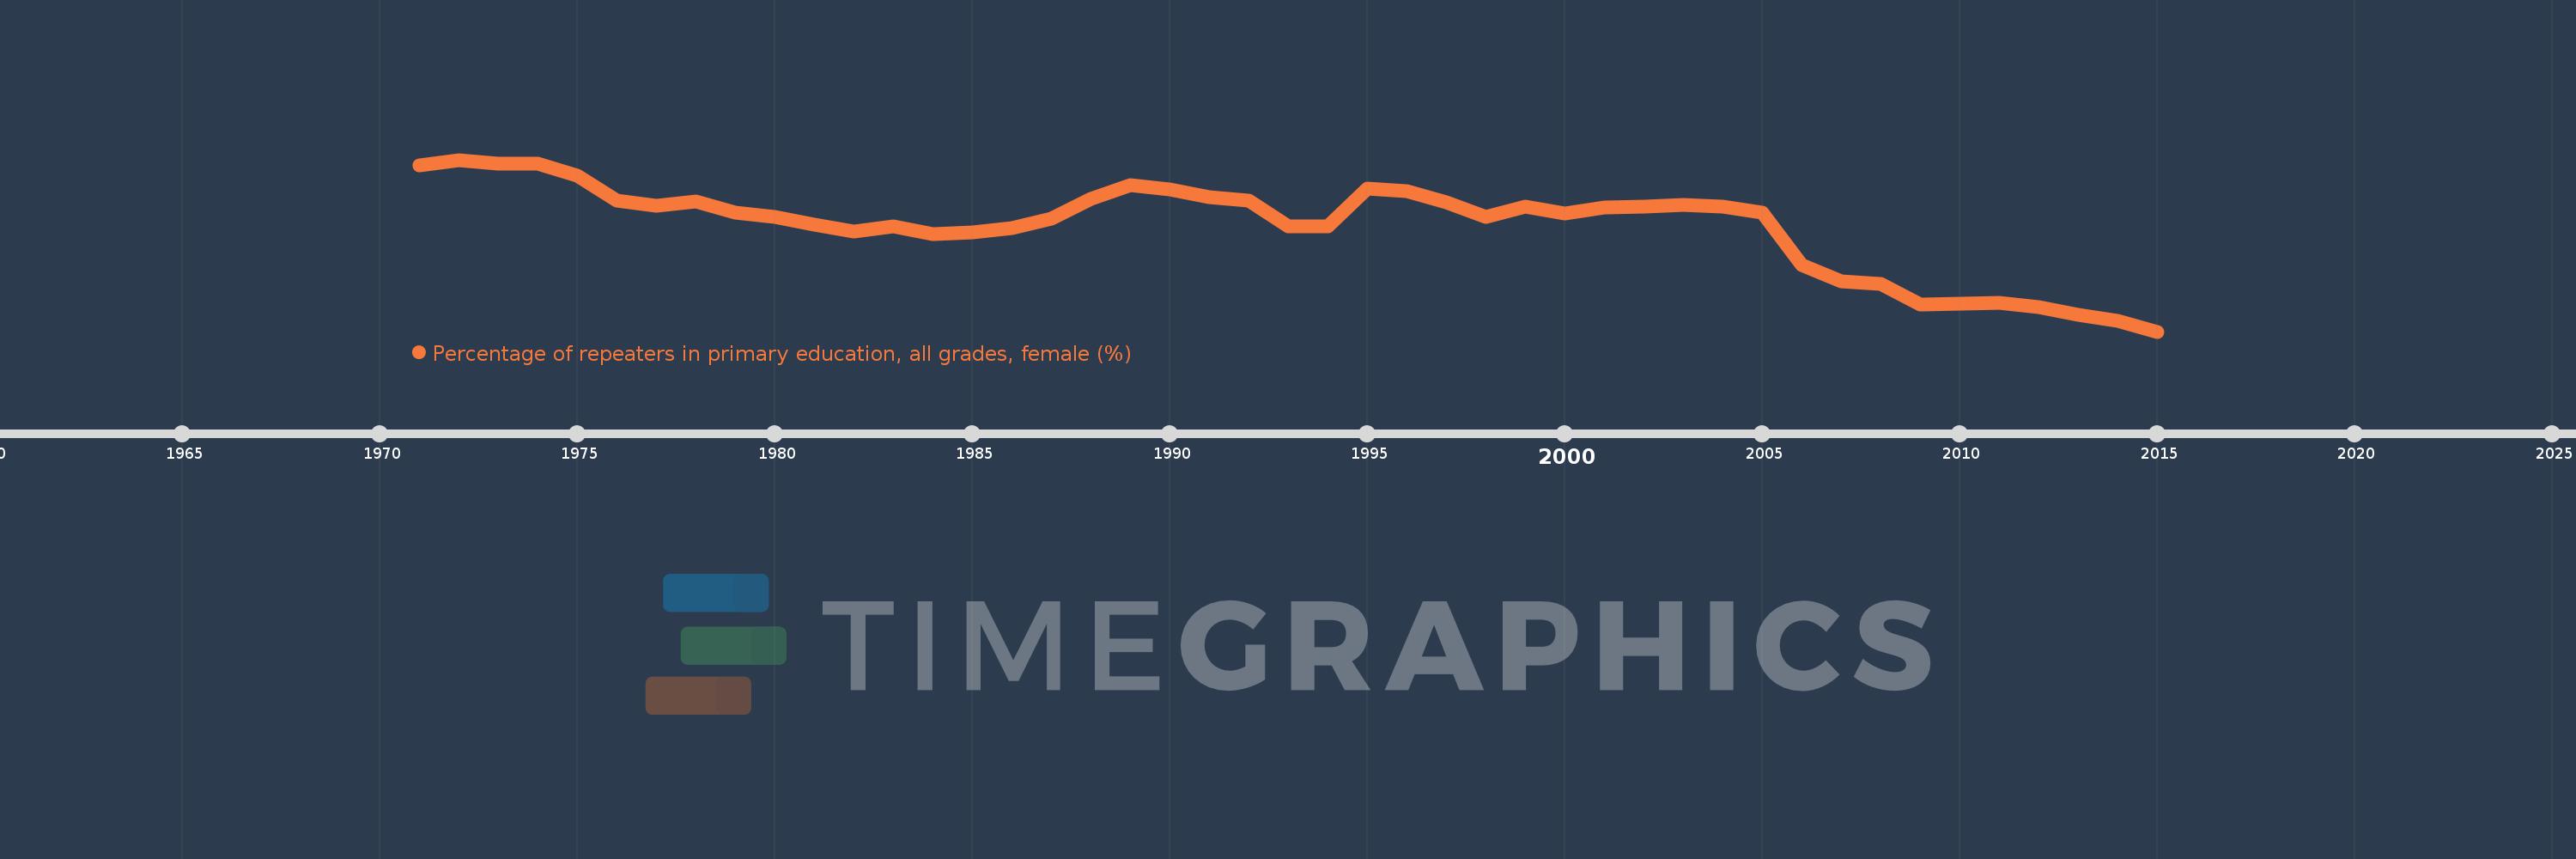
Percentage of repeaters in primary education, all grades, female (%)
2015,2014,2013,2012,2011,2010,2009,2008,2007,2006,2005,2004,2003,2002,2001,2000,1999,1998,1997,1996,1995,1994,1993,1992,1991,1990,1989,1988,1987,1986,1985,1984,1983,1982,1981,1980,1979,1978,1977,1976,1975,1974,1973,1972,1971
This statistics in other country:
AfghanistanAlbaniaAlgeriaAndorraAngolaAntigua and BarbudaArab WorldArgentinaArmeniaArubaAustriaAzerbaijanBahamas, TheBahrainBangladeshBelarusBelgiumBelizeBeninBermudaBhutanBoliviaBosnia and HerzegovinaBotswanaBrazilBritish Virgin IslandsBrunei DarussalamBulgariaBurkina FasoBurundiCabo VerdeCambodiaCameroonCanadaCaribbean small statesCayman IslandsCentral African RepublicCentral Europe and the BalticsChadChileChinaColombiaComorosCongo, Dem. Rep.Congo, Rep.Costa RicaCote d'IvoireCroatiaCubaCyprusCzech RepublicDenmarkDjiboutiDominicaDominican RepublicEarly-demographic dividendEast Asia & PacificEast Asia & Pacific (excluding high income)East Asia & Pacific (IDA & IBRD countries)EcuadorEgypt, Arab Rep.El SalvadorEquatorial GuineaEritreaEstoniaEthiopiaEuro areaEurope & Central AsiaEurope & Central Asia (excluding high income)Europe & Central Asia (IDA & IBRD countries)European UnionFijiFinlandFragile and conflict affected situationsFranceGabonGambia, TheGeorgiaGermanyGhanaGreeceGrenadaGuatemalaGuineaGuinea-BissauGuyanaHaitiHeavily indebted poor countries (HIPC)High incomeHondurasHong Kong SAR, ChinaHungaryIBRD onlyIcelandIDA & IBRD totalIDA blendIDA onlyIDA totalIndiaIndonesiaIran, Islamic Rep.IraqIrelandIsraelItalyJamaicaJapanJordanKazakhstanKenyaKiribatiKorea, Rep.KuwaitKyrgyz RepublicLao PDRLate-demographic dividendLatin America & Caribbean Latin America & Caribbean (excluding high income)Latin America & the Caribbean (IDA & IBRD countries)LatviaLeast developed countries: UN classificationLebanonLesothoLiberiaLibyaLiechtensteinLithuaniaLow & middle incomeLow incomeLower middle incomeLuxembourgMacao SAR, ChinaMacedonia, FYRMadagascarMalawiMalaysiaMaldivesMaliMaltaMauritaniaMauritiusMexicoMiddle East & North AfricaMiddle East & North Africa (excluding high income)Middle East & North Africa (IDA & IBRD countries)Middle incomeMoldovaMonacoMongoliaMontenegroMoroccoMozambiqueMyanmarNamibiaNauruNepalNetherlandsNew ZealandNicaraguaNigerNorwayOECD membersOmanOther small statesPacific island small statesPakistanPalauPanamaPapua New GuineaParaguayPeruPhilippinesPolandPortugalPost-demographic dividendPre-demographic dividendQatarRomaniaRussian FederationRwandaSamoaSan MarinoSao Tome and PrincipeSaudi ArabiaSenegalSerbiaSeychellesSierra LeoneSingaporeSint Maarten (Dutch part)Slovak RepublicSloveniaSmall statesSolomon IslandsSomaliaSouth AfricaSouth AsiaSouth Asia (IDA & IBRD)South SudanSpainSri LankaSt. Kitts and NevisSt. LuciaSt. Vincent and the GrenadinesSub-Saharan Africa Sub-Saharan Africa (excluding high income)Sub-Saharan Africa (IDA & IBRD countries)SudanSurinameSwazilandSwedenSwitzerlandSyrian Arab RepublicTajikistanTanzaniaThailandTimor-LesteTogoTongaTrinidad and TobagoTunisiaTurkeyTurks and Caicos IslandsTuvaluUgandaUkraineUnited Arab EmiratesUnited KingdomUpper middle incomeUruguayUzbekistanVanuatuVenezuela, RBVietnamWest Bank and GazaWorldYemen, Rep.ZambiaZimbabwe Timeline:
This timeline shows a graph from 1971 to 2015 of Low income. No data until 1970. Number of actual observations by date: 45.
Source name:
World Development Indicators
Source organization:
UNESCO Institute for Statistics
Categories, topics:
Education, Gender
Last updated:
apr 23, 2017
Indicators value changes by year
Minimum:
10.095
jan 1, 2015
Maximum:
16.188
jan 1, 1972
At the date of observation
Value
Absolute change
Change from previous value
jan 1, 1971
15.981
+15.981
0.0%
jan 1, 1972
16.188
+0.207
1.3%
jan 1, 1973
16.062
-0.126
-0.78%
jan 1, 1974
16.052
-0.01
-0.06%
jan 1, 1975
15.632
-0.42
-2.61%
jan 1, 1976
14.748
-0.884
-5.66%
jan 1, 1977
14.562
-0.187
-1.27%
jan 1, 1978
14.7
+0.138
0.95%
jan 1, 1979
14.307
-0.393
-2.67%
jan 1, 1980
14.169
-0.138
-0.96%
jan 1, 1981
13.891
-0.278
-1.96%
jan 1, 1982
13.649
-0.242
-1.74%
jan 1, 1983
13.821
+0.172
1.26%
jan 1, 1984
13.541
-0.28
-2.03%
jan 1, 1985
13.62
+0.079
0.58%
jan 1, 1986
13.78
+0.16
1.18%
jan 1, 1987
14.095
+0.315
2.29%
jan 1, 1988
14.798
+0.703
4.99%
jan 1, 1989
15.275
+0.477
3.23%
jan 1, 1990
15.141
-0.134
-0.88%
jan 1, 1991
14.853
-0.288
-1.9%
jan 1, 1992
14.744
-0.11
-0.74%
jan 1, 1993
13.838
-0.906
-6.14%
jan 1, 1994
13.842
+0.003
0.03%
jan 1, 1995
15.166
+1.325
9.57%
jan 1, 1996
15.09
-0.076
-0.5%
jan 1, 1997
14.68
-0.41
-2.72%
jan 1, 1998
14.177
-0.503
-3.42%
jan 1, 1999
14.514
+0.336
2.37%
jan 1, 2000
14.275
-0.238
-1.64%
jan 1, 2001
14.493
+0.217
1.52%
jan 1, 2002
14.534
+0.042
0.29%
jan 1, 2003
14.596
+0.062
0.43%
jan 1, 2004
14.526
-0.07
-0.48%
jan 1, 2005
14.306
-0.22
-1.52%
jan 1, 2006
12.444
-1.862
-13.01%
jan 1, 2007
11.868
-0.576
-4.63%
jan 1, 2008
11.797
-0.071
-0.6%
jan 1, 2009
11.057
-0.741
-6.28%
jan 1, 2010
11.072
+0.016
0.14%
jan 1, 2011
11.12
+0.048
0.43%
jan 1, 2012
10.971
-0.149
-1.34%
jan 1, 2013
10.701
-0.27
-2.46%
jan 1, 2014
10.475
-0.226
-2.11%
jan 1, 2015
10.095
-0.38
-3.63%
Ranking of countries by current statistics by years


Comments: