29
/
en
AIzaSyAYiBZKx7MnpbEhh9jyipgxe19OcubqV5w
April 1, 2024
107736
Colombia
COL
true
2
1
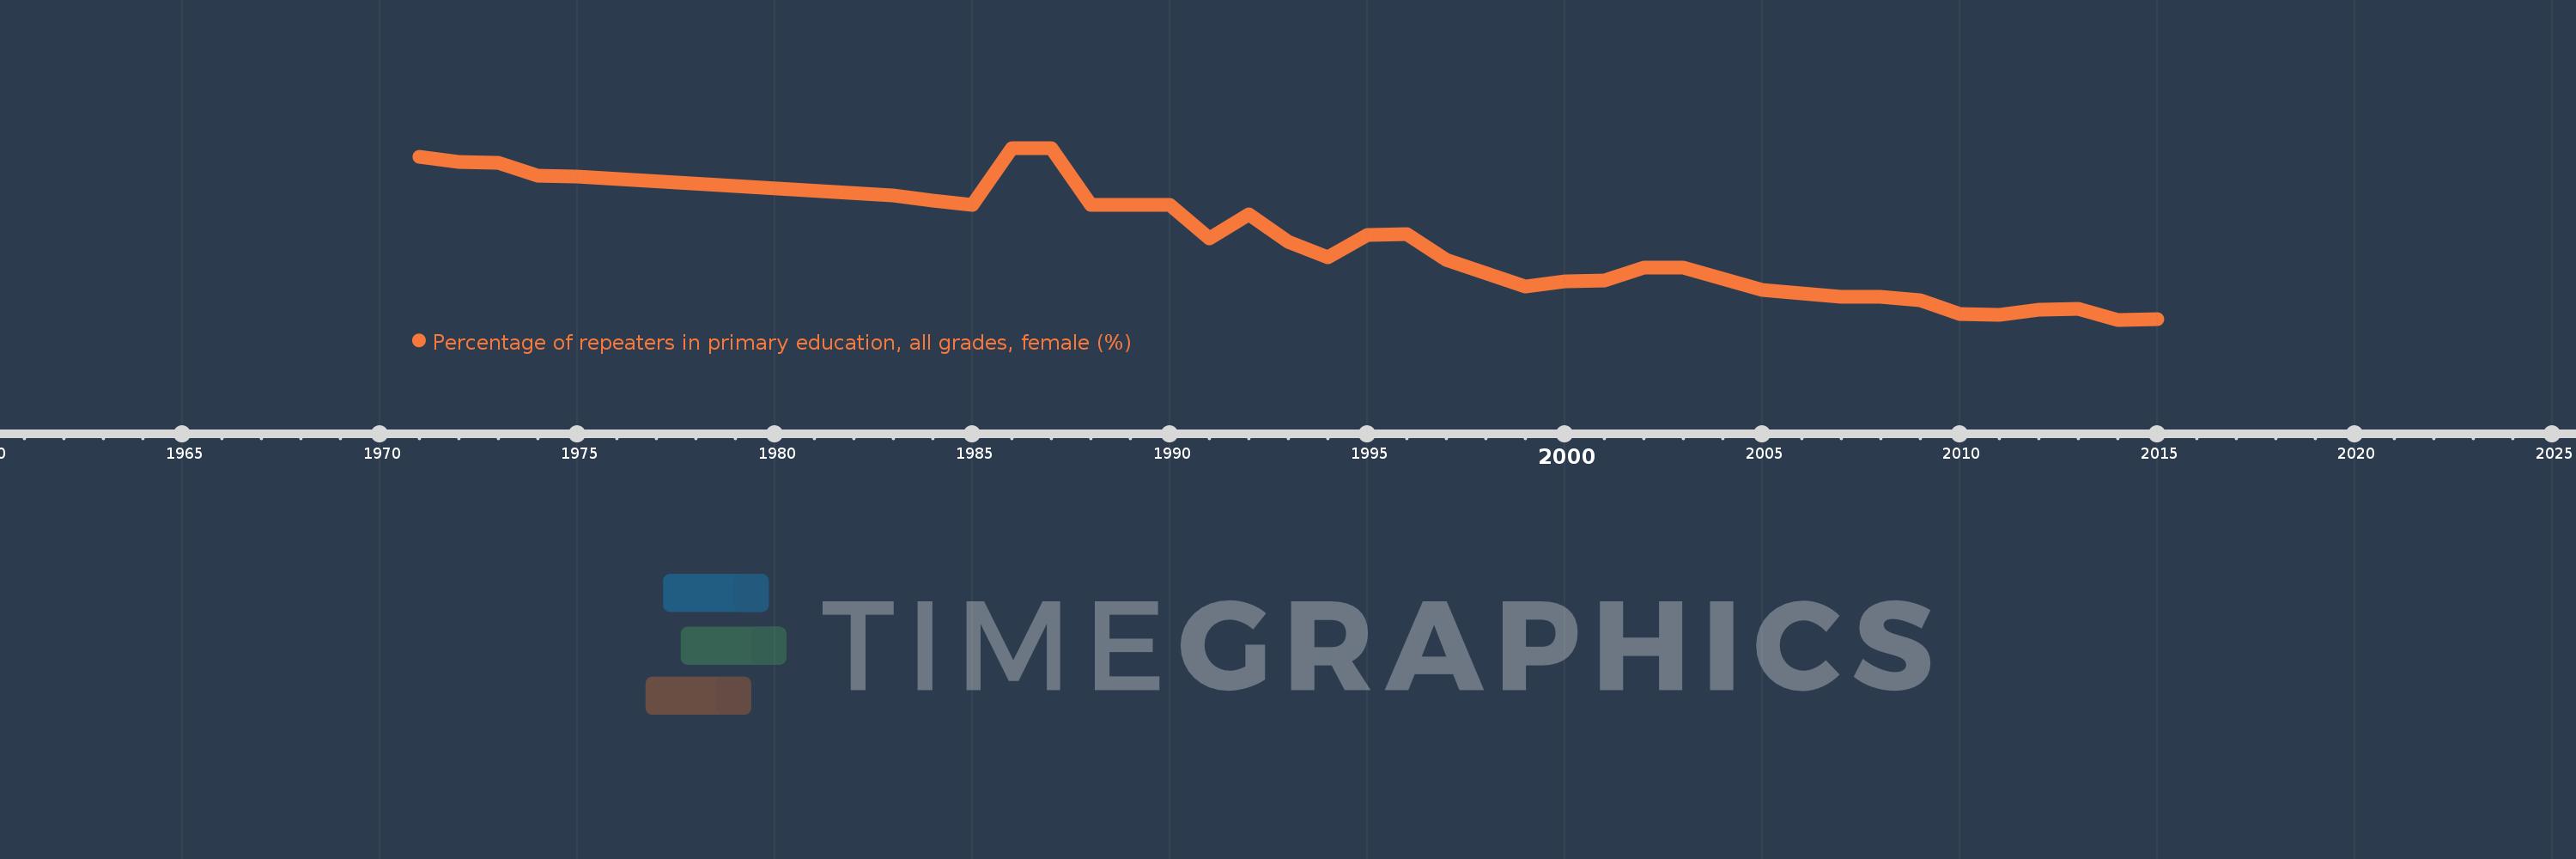
Percentage of repeaters in primary education, all grades, female (%)
2015,2014,2013,2012,2011,2010,2009,2008,2007,2006,2005,2003,2002,2001,2000,1999,1997,1996,1995,1994,1993,1992,1991,1990,1989,1988,1987,1986,1985,1984,1983,1975,1974,1973,1972,1971
This statistics in other country:
AfghanistanAlbaniaAlgeriaAndorraAngolaAntigua and BarbudaArab WorldArgentinaArmeniaArubaAustriaAzerbaijanBahamas, TheBahrainBangladeshBelarusBelgiumBelizeBeninBermudaBhutanBoliviaBosnia and HerzegovinaBotswanaBrazilBritish Virgin IslandsBrunei DarussalamBulgariaBurkina FasoBurundiCabo VerdeCambodiaCameroonCanadaCaribbean small statesCayman IslandsCentral African RepublicCentral Europe and the BalticsChadChileChinaColombiaComorosCongo, Dem. Rep.Congo, Rep.Costa RicaCote d'IvoireCroatiaCubaCyprusCzech RepublicDenmarkDjiboutiDominicaDominican RepublicEarly-demographic dividendEast Asia & PacificEast Asia & Pacific (excluding high income)East Asia & Pacific (IDA & IBRD countries)EcuadorEgypt, Arab Rep.El SalvadorEquatorial GuineaEritreaEstoniaEthiopiaEuro areaEurope & Central AsiaEurope & Central Asia (excluding high income)Europe & Central Asia (IDA & IBRD countries)European UnionFijiFinlandFragile and conflict affected situationsFranceGabonGambia, TheGeorgiaGermanyGhanaGreeceGrenadaGuatemalaGuineaGuinea-BissauGuyanaHaitiHeavily indebted poor countries (HIPC)High incomeHondurasHong Kong SAR, ChinaHungaryIBRD onlyIcelandIDA & IBRD totalIDA blendIDA onlyIDA totalIndiaIndonesiaIran, Islamic Rep.IraqIrelandIsraelItalyJamaicaJapanJordanKazakhstanKenyaKiribatiKorea, Rep.KuwaitKyrgyz RepublicLao PDRLate-demographic dividendLatin America & Caribbean Latin America & Caribbean (excluding high income)Latin America & the Caribbean (IDA & IBRD countries)LatviaLeast developed countries: UN classificationLebanonLesothoLiberiaLibyaLiechtensteinLithuaniaLow & middle incomeLow incomeLower middle incomeLuxembourgMacao SAR, ChinaMacedonia, FYRMadagascarMalawiMalaysiaMaldivesMaliMaltaMauritaniaMauritiusMexicoMiddle East & North AfricaMiddle East & North Africa (excluding high income)Middle East & North Africa (IDA & IBRD countries)Middle incomeMoldovaMonacoMongoliaMontenegroMoroccoMozambiqueMyanmarNamibiaNauruNepalNetherlandsNew ZealandNicaraguaNigerNorwayOECD membersOmanOther small statesPacific island small statesPakistanPalauPanamaPapua New GuineaParaguayPeruPhilippinesPolandPortugalPost-demographic dividendPre-demographic dividendQatarRomaniaRussian FederationRwandaSamoaSan MarinoSao Tome and PrincipeSaudi ArabiaSenegalSerbiaSeychellesSierra LeoneSingaporeSint Maarten (Dutch part)Slovak RepublicSloveniaSmall statesSolomon IslandsSomaliaSouth AfricaSouth AsiaSouth Asia (IDA & IBRD)South SudanSpainSri LankaSt. Kitts and NevisSt. LuciaSt. Vincent and the GrenadinesSub-Saharan Africa Sub-Saharan Africa (excluding high income)Sub-Saharan Africa (IDA & IBRD countries)SudanSurinameSwazilandSwedenSwitzerlandSyrian Arab RepublicTajikistanTanzaniaThailandTimor-LesteTogoTongaTrinidad and TobagoTunisiaTurkeyTurks and Caicos IslandsTuvaluUgandaUkraineUnited Arab EmiratesUnited KingdomUpper middle incomeUruguayUzbekistanVanuatuVenezuela, RBVietnamWest Bank and GazaWorldYemen, Rep.ZambiaZimbabwe Timeline:
This timeline shows a graph from 1971 to 2015 of Colombia. No data until 1970. Number of actual observations by date: 36.
Source name:
World Development Indicators
Source organization:
UNESCO Institute for Statistics
Categories, topics:
Education, Gender
Last updated:
apr 23, 2017
Indicators value changes by year
Maximum:
16.751
jan 1, 1986
At the date of observation
Value
Absolute change
Change from previous value
jan 1, 1971
15.972
+15.972
0.0%
jan 1, 1972
15.502
-0.47
-2.94%
jan 1, 1973
15.378
-0.124
-0.8%
jan 1, 1974
14.234
-1.144
-7.44%
jan 1, 1975
14.194
-0.04
-0.28%
jan 1, 1983
12.432
-1.762
-12.41%
jan 1, 1984
11.974
-0.458
-3.68%
jan 1, 1985
11.588
-0.386
-3.22%
jan 1, 1986
16.751
+5.162
44.55%
jan 1, 1987
16.751
0.0
0.0%
jan 1, 1988
11.589
-5.162
-30.82%
jan 1, 1989
11.589
+0.0
0.0%
jan 1, 1990
11.589
0.0
0.0%
jan 1, 1991
8.542
-3.047
-26.29%
jan 1, 1992
10.703
+2.161
25.3%
jan 1, 1993
8.199
-2.504
-23.4%
jan 1, 1994
6.861
-1.337
-16.31%
jan 1, 1995
8.831
+1.97
28.71%
jan 1, 1996
8.903
+0.072
0.81%
jan 1, 1997
6.62
-2.283
-25.64%
jan 1, 1999
4.209
-2.411
-36.43%
jan 1, 2000
4.633
+0.424
10.07%
jan 1, 2001
4.748
+0.115
2.49%
jan 1, 2002
5.887
+1.138
23.97%
jan 1, 2003
5.886
-0.001
-0.01%
jan 1, 2005
3.836
-2.05
-34.83%
jan 1, 2006
3.585
-0.251
-6.53%
jan 1, 2007
3.282
-0.303
-8.45%
jan 1, 2008
3.217
-0.065
-1.99%
jan 1, 2009
2.958
-0.259
-8.06%
jan 1, 2010
1.678
-1.28
-43.27%
jan 1, 2011
1.647
-0.031
-1.85%
jan 1, 2012
2.086
+0.439
26.67%
jan 1, 2013
2.141
+0.055
2.62%
jan 1, 2014
1.169
-0.972
-45.4%
jan 1, 2015
1.248
+0.079
6.75%
Ranking of countries by current statistics by years


Comments: