29
/
en
AIzaSyAYiBZKx7MnpbEhh9jyipgxe19OcubqV5w
April 1, 2024
258767
Syrian Arab Republic
SYR
true
2
1
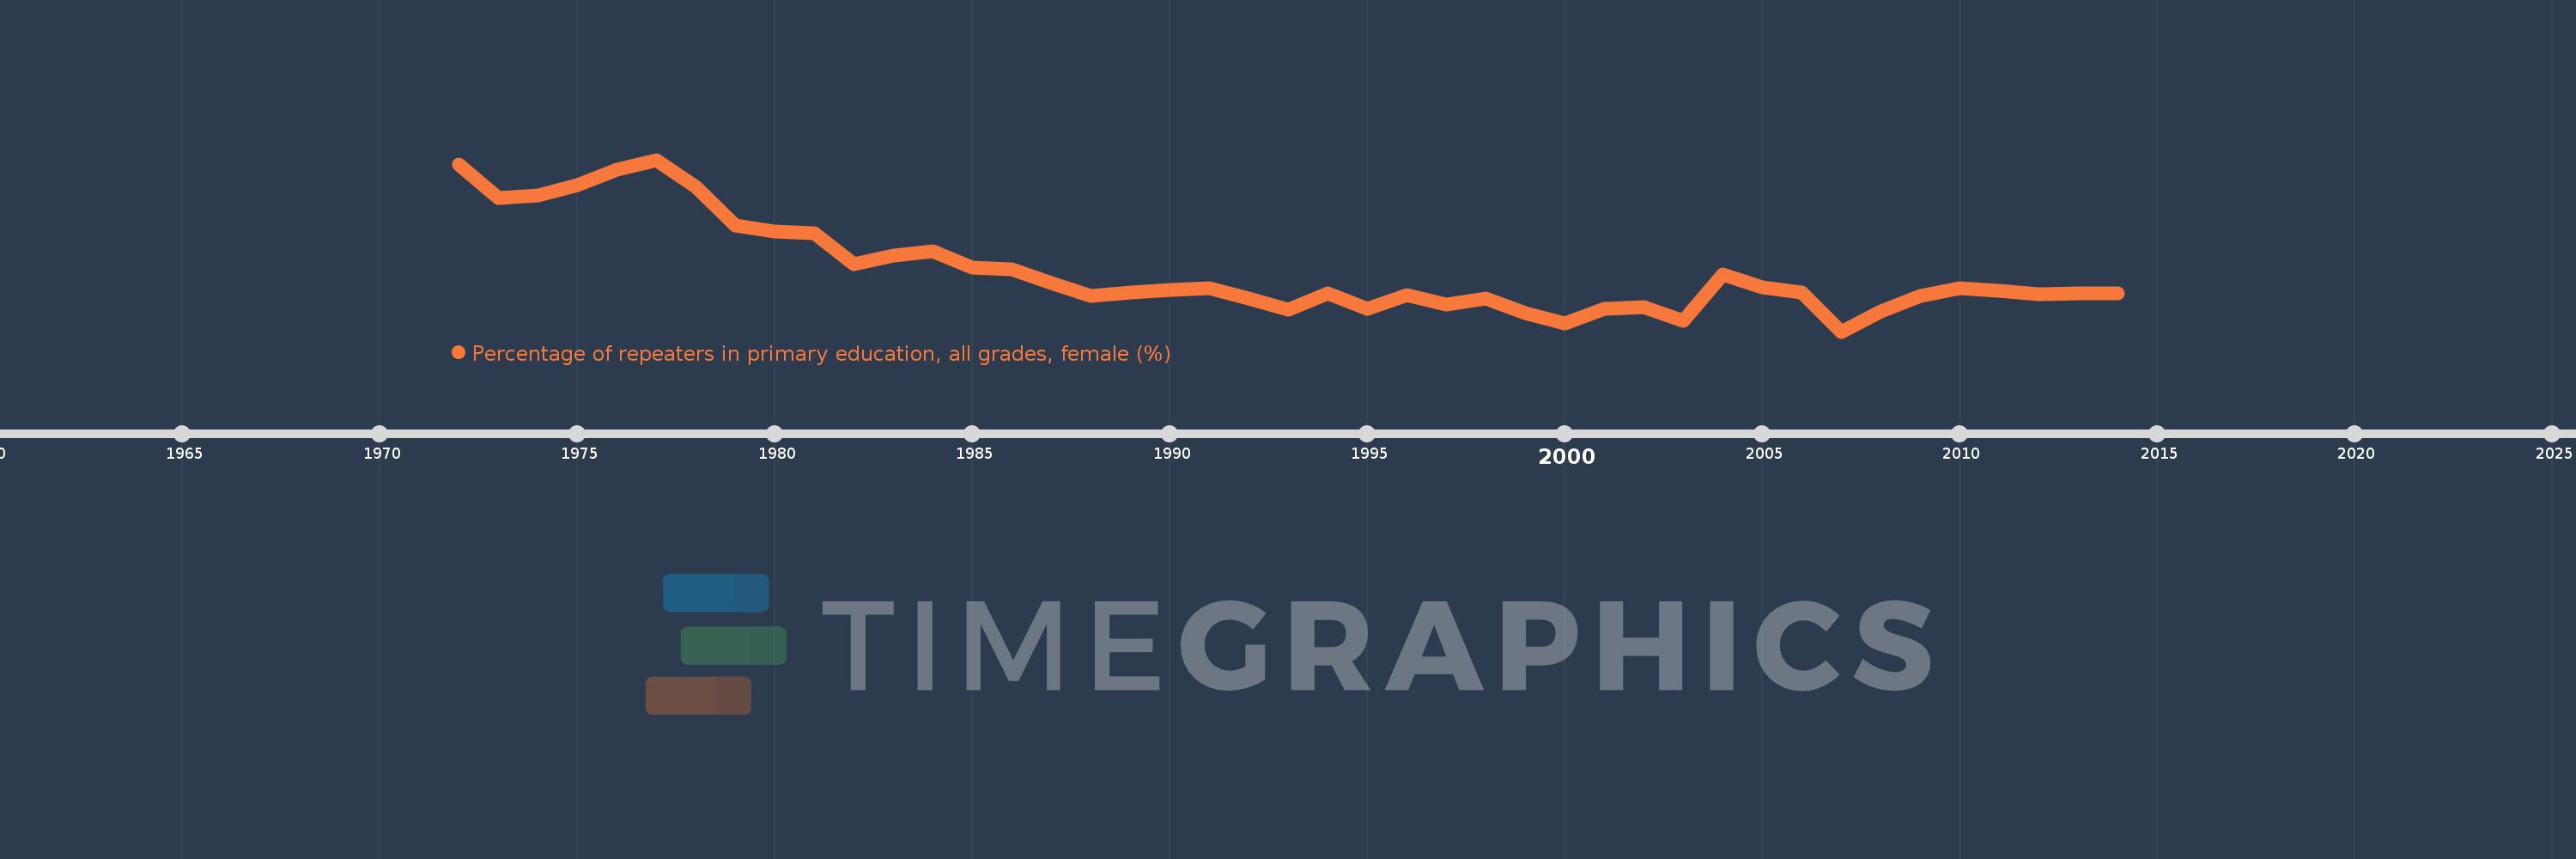
Percentage of repeaters in primary education, all grades, female (%)
2014,2013,2012,2011,2010,2009,2008,2007,2006,2005,2004,2003,2002,2001,2000,1999,1998,1997,1996,1995,1994,1993,1992,1991,1990,1989,1988,1987,1986,1985,1984,1983,1982,1981,1980,1979,1978,1977,1976,1975,1974,1973,1972
This statistics in other country:
AfghanistanAlbaniaAlgeriaAndorraAngolaAntigua and BarbudaArab WorldArgentinaArmeniaArubaAustriaAzerbaijanBahamas, TheBahrainBangladeshBelarusBelgiumBelizeBeninBermudaBhutanBoliviaBosnia and HerzegovinaBotswanaBrazilBritish Virgin IslandsBrunei DarussalamBulgariaBurkina FasoBurundiCabo VerdeCambodiaCameroonCanadaCaribbean small statesCayman IslandsCentral African RepublicCentral Europe and the BalticsChadChileChinaColombiaComorosCongo, Dem. Rep.Congo, Rep.Costa RicaCote d'IvoireCroatiaCubaCyprusCzech RepublicDenmarkDjiboutiDominicaDominican RepublicEarly-demographic dividendEast Asia & PacificEast Asia & Pacific (excluding high income)East Asia & Pacific (IDA & IBRD countries)EcuadorEgypt, Arab Rep.El SalvadorEquatorial GuineaEritreaEstoniaEthiopiaEuro areaEurope & Central AsiaEurope & Central Asia (excluding high income)Europe & Central Asia (IDA & IBRD countries)European UnionFijiFinlandFragile and conflict affected situationsFranceGabonGambia, TheGeorgiaGermanyGhanaGreeceGrenadaGuatemalaGuineaGuinea-BissauGuyanaHaitiHeavily indebted poor countries (HIPC)High incomeHondurasHong Kong SAR, ChinaHungaryIBRD onlyIcelandIDA & IBRD totalIDA blendIDA onlyIDA totalIndiaIndonesiaIran, Islamic Rep.IraqIrelandIsraelItalyJamaicaJapanJordanKazakhstanKenyaKiribatiKorea, Rep.KuwaitKyrgyz RepublicLao PDRLate-demographic dividendLatin America & Caribbean Latin America & Caribbean (excluding high income)Latin America & the Caribbean (IDA & IBRD countries)LatviaLeast developed countries: UN classificationLebanonLesothoLiberiaLibyaLiechtensteinLithuaniaLow & middle incomeLow incomeLower middle incomeLuxembourgMacao SAR, ChinaMacedonia, FYRMadagascarMalawiMalaysiaMaldivesMaliMaltaMauritaniaMauritiusMexicoMiddle East & North AfricaMiddle East & North Africa (excluding high income)Middle East & North Africa (IDA & IBRD countries)Middle incomeMoldovaMonacoMongoliaMontenegroMoroccoMozambiqueMyanmarNamibiaNauruNepalNetherlandsNew ZealandNicaraguaNigerNorwayOECD membersOmanOther small statesPacific island small statesPakistanPalauPanamaPapua New GuineaParaguayPeruPhilippinesPolandPortugalPost-demographic dividendPre-demographic dividendQatarRomaniaRussian FederationRwandaSamoaSan MarinoSao Tome and PrincipeSaudi ArabiaSenegalSerbiaSeychellesSierra LeoneSingaporeSint Maarten (Dutch part)Slovak RepublicSloveniaSmall statesSolomon IslandsSomaliaSouth AfricaSouth AsiaSouth Asia (IDA & IBRD)South SudanSpainSri LankaSt. Kitts and NevisSt. LuciaSt. Vincent and the GrenadinesSub-Saharan Africa Sub-Saharan Africa (excluding high income)Sub-Saharan Africa (IDA & IBRD countries)SudanSurinameSwazilandSwedenSwitzerlandSyrian Arab RepublicTajikistanTanzaniaThailandTimor-LesteTogoTongaTrinidad and TobagoTunisiaTurkeyTurks and Caicos IslandsTuvaluUgandaUkraineUnited Arab EmiratesUnited KingdomUpper middle incomeUruguayUzbekistanVanuatuVenezuela, RBVietnamWest Bank and GazaWorldYemen, Rep.ZambiaZimbabwe Timeline:
This timeline shows a graph from 1972 to 2014 of Syrian Arab Republic. No data until 1971. Number of actual observations by date: 43.
Source name:
World Development Indicators
Source organization:
UNESCO Institute for Statistics
Categories, topics:
Education, Gender
Last updated:
apr 23, 2017
Indicators value changes by year
At the date of observation
Value
Absolute change
Change from previous value
jan 1, 1972
9.769
+9.769
0.0%
jan 1, 1973
8.886
-0.883
-9.04%
jan 1, 1974
8.961
+0.075
0.85%
jan 1, 1975
9.222
+0.261
2.91%
jan 1, 1976
9.629
+0.406
4.41%
jan 1, 1977
9.895
+0.267
2.77%
jan 1, 1978
9.194
-0.701
-7.08%
jan 1, 1979
8.18
-1.014
-11.03%
jan 1, 1980
8.022
-0.159
-1.94%
jan 1, 1981
7.968
-0.053
-0.66%
jan 1, 1982
7.169
-0.8
-10.04%
jan 1, 1983
7.4
+0.231
3.22%
jan 1, 1984
7.504
+0.105
1.41%
jan 1, 1985
7.067
-0.437
-5.82%
jan 1, 1986
7.04
-0.027
-0.38%
jan 1, 1987
6.667
-0.373
-5.31%
jan 1, 1988
6.326
-0.341
-5.11%
jan 1, 1989
6.435
+0.108
1.71%
jan 1, 1990
6.493
+0.058
0.9%
jan 1, 1991
6.53
+0.037
0.58%
jan 1, 1992
6.269
-0.261
-4.0%
jan 1, 1993
5.982
-0.287
-4.57%
jan 1, 1994
6.394
+0.411
6.88%
jan 1, 1995
6.007
-0.387
-6.05%
jan 1, 1996
6.367
+0.36
6.0%
jan 1, 1997
6.121
-0.246
-3.86%
jan 1, 1998
6.278
+0.157
2.56%
jan 1, 1999
5.883
-0.395
-6.29%
jan 1, 2000
5.614
-0.269
-4.57%
jan 1, 2001
5.989
+0.375
6.68%
jan 1, 2002
6.049
+0.061
1.01%
jan 1, 2003
5.692
-0.357
-5.91%
jan 1, 2004
6.906
+1.214
21.33%
jan 1, 2005
6.564
-0.342
-4.96%
jan 1, 2006
6.433
-0.131
-2.0%
jan 1, 2007
5.403
-1.03
-16.01%
jan 1, 2008
5.929
+0.526
9.73%
jan 1, 2009
6.342
+0.413
6.97%
jan 1, 2010
6.538
+0.197
3.1%
jan 1, 2011
6.479
-0.059
-0.9%
jan 1, 2012
6.391
-0.089
-1.37%
jan 1, 2013
6.409
+0.018
0.28%
jan 1, 2014
6.398
-0.011
-0.17%
Ranking of countries by current statistics by years


Comments: