29
/
en
AIzaSyAYiBZKx7MnpbEhh9jyipgxe19OcubqV5w
April 1, 2024
44053
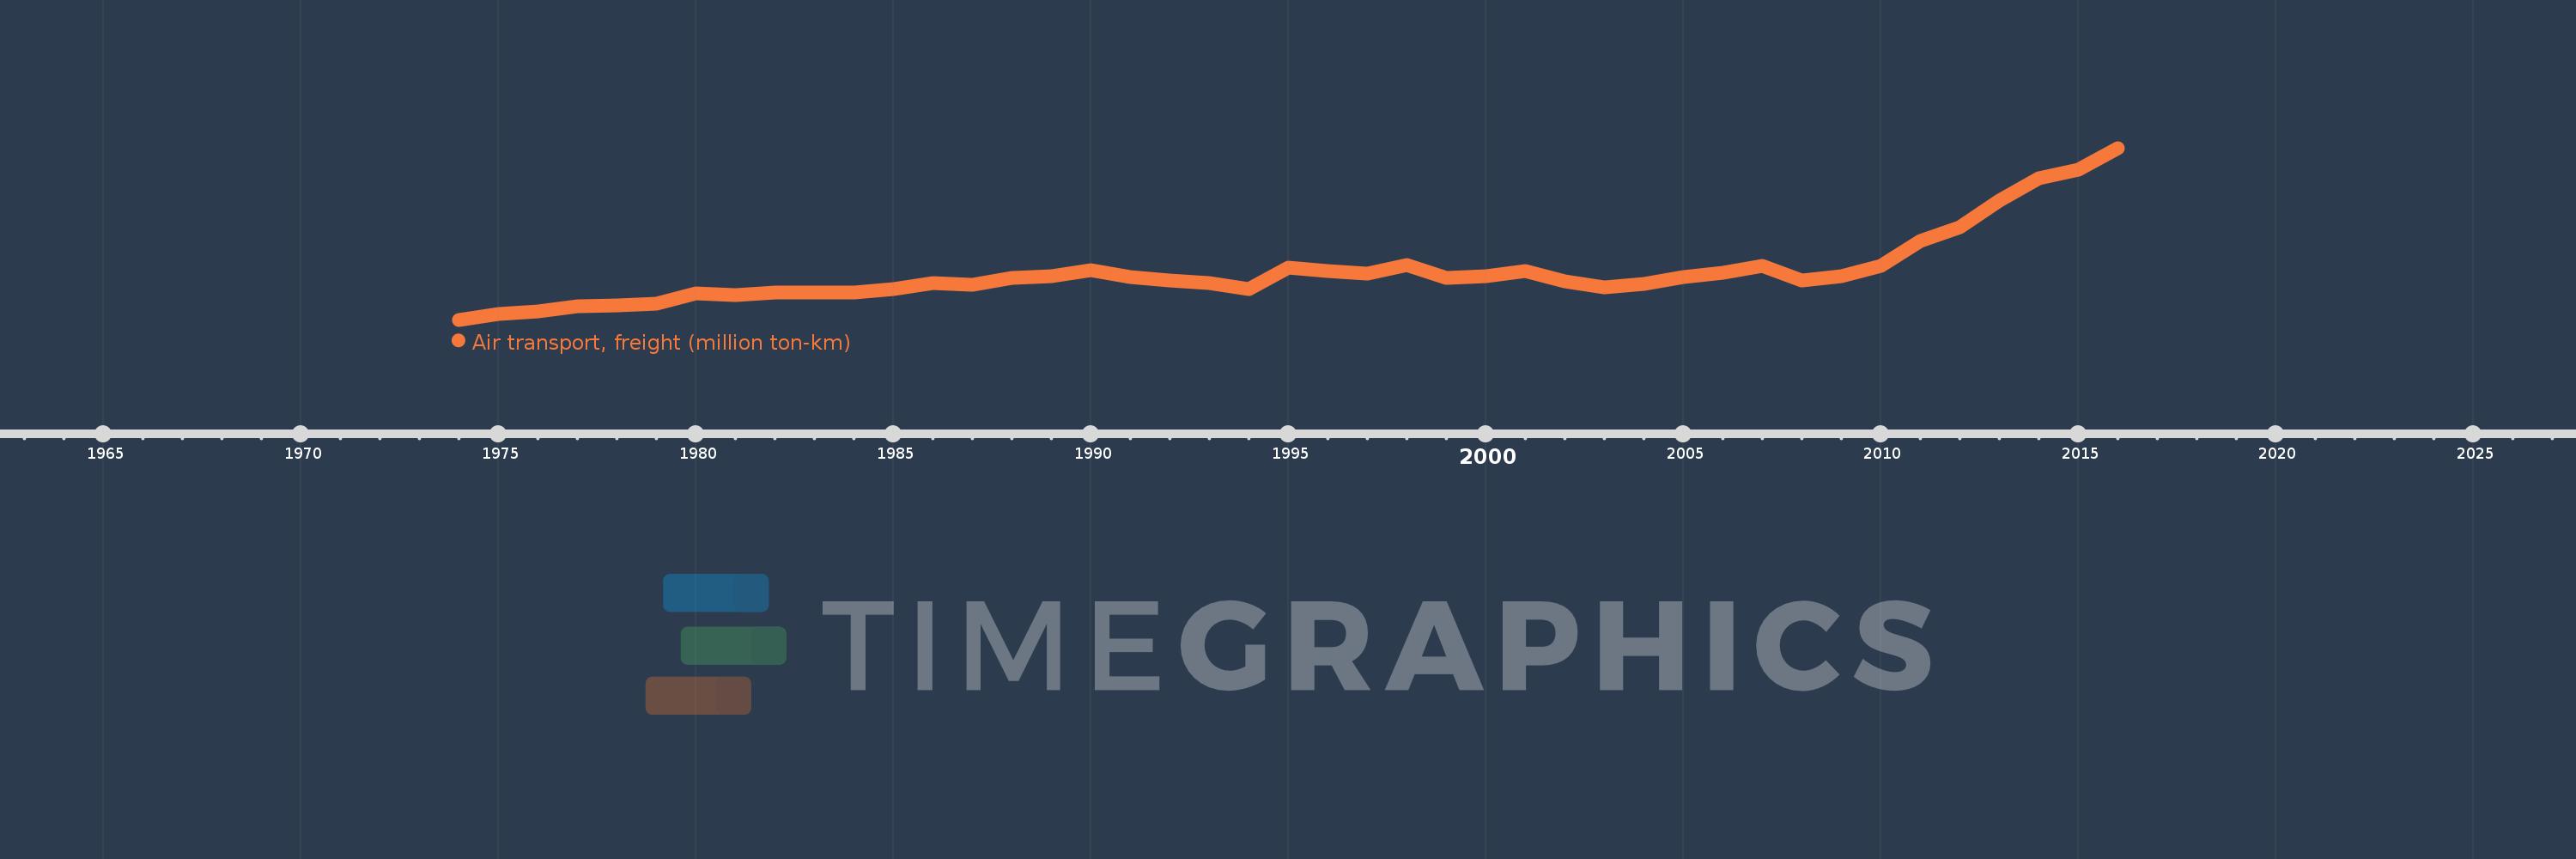
Least developed countries: UN classification
LDC
false
2
1
Air transport, freight (million ton-km)
2016,2015,2014,2013,2012,2011,2010,2009,2008,2007,2006,2005,2004,2003,2002,2001,2000,1999,1998,1997,1996,1995,1994,1993,1992,1991,1990,1989,1988,1987,1986,1985,1984,1983,1982,1981,1980,1979,1978,1977,1976,1975,1974
This statistics in other country:
AfghanistanAlbaniaAlgeriaAmerican SamoaAngolaAntigua and BarbudaArab WorldArgentinaArmeniaAustraliaAustriaAzerbaijanBahamas, TheBahrainBangladeshBarbadosBelarusBelgiumBelizeBeninBhutanBoliviaBosnia and HerzegovinaBotswanaBrazilBrunei DarussalamBulgariaBurkina FasoBurundiCabo VerdeCambodiaCameroonCanadaCaribbean small statesCentral African RepublicCentral Europe and the BalticsChadChileChinaColombiaComorosCongo, Dem. Rep.Congo, Rep.Costa RicaCote d'IvoireCroatiaCubaCyprusCzech RepublicDenmarkDjiboutiDominican RepublicEarly-demographic dividendEast Asia & PacificEast Asia & Pacific (excluding high income)East Asia & Pacific (IDA & IBRD countries)EcuadorEgypt, Arab Rep.El SalvadorEquatorial GuineaEritreaEstoniaEthiopiaEuro areaEurope & Central AsiaEurope & Central Asia (excluding high income)Europe & Central Asia (IDA & IBRD countries)European UnionFijiFinlandFragile and conflict affected situationsFranceGabonGambia, TheGeorgiaGermanyGhanaGreeceGuamGuatemalaGuineaGuinea-BissauGuyanaHaitiHeavily indebted poor countries (HIPC)High incomeHondurasHong Kong SAR, ChinaHungaryIBRD onlyIcelandIDA & IBRD totalIDA blendIDA onlyIDA totalIndiaIndonesiaIran, Islamic Rep.IraqIrelandIsraelItalyJamaicaJapanJordanKazakhstanKenyaKiribatiKorea, Dem. People’s Rep.Korea, Rep.KuwaitKyrgyz RepublicLao PDRLate-demographic dividendLatin America & Caribbean Latin America & Caribbean (excluding high income)Latin America & the Caribbean (IDA & IBRD countries)LatviaLeast developed countries: UN classificationLebanonLesothoLiberiaLibyaLithuaniaLow & middle incomeLow incomeLower middle incomeLuxembourgMacao SAR, ChinaMacedonia, FYRMadagascarMalawiMalaysiaMaldivesMaliMaltaMarshall IslandsMauritaniaMauritiusMexicoMiddle East & North AfricaMiddle East & North Africa (excluding high income)Middle East & North Africa (IDA & IBRD countries)Middle incomeMoldovaMonacoMongoliaMontenegroMoroccoMozambiqueMyanmarNamibiaNauruNepalNetherlandsNew ZealandNicaraguaNigerNigeriaNorth AmericaNorwayOECD membersOmanOther small statesPacific island small statesPakistanPanamaPapua New GuineaParaguayPeruPhilippinesPolandPortugalPost-demographic dividendPre-demographic dividendQatarRomaniaRussian FederationRwandaSamoaSao Tome and PrincipeSaudi ArabiaSenegalSerbiaSeychellesSierra LeoneSingaporeSlovak RepublicSloveniaSmall statesSolomon IslandsSomaliaSouth AfricaSouth AsiaSouth Asia (IDA & IBRD)SpainSri LankaSub-Saharan Africa Sub-Saharan Africa (excluding high income)Sub-Saharan Africa (IDA & IBRD countries)SudanSurinameSwazilandSwedenSwitzerlandSyrian Arab RepublicTajikistanTanzaniaThailandTogoTongaTrinidad and TobagoTunisiaTurkeyTurkmenistanUgandaUkraineUnited Arab EmiratesUnited KingdomUnited StatesUpper middle incomeUruguayUzbekistanVanuatuVenezuela, RBVietnamWorldYemen, Rep.ZambiaZimbabwe Timeline:
This timeline shows a graph from 1974 to 2016 of Least developed countries: UN classification. No data until 1973. Number of actual observations by date: 43.
Source name:
World Development Indicators
Source organization:
International Civil Aviation Organization, Civil Aviation Statistics of the World and ICAO staff estimates.
Categories, topics:
Infrastructure
Last updated:
apr 23, 2017
Indicators value changes by year
Maximum:
1.664K
jan 1, 2016
At the date of observation
Value
Absolute change
Change from previous value
jan 1, 1974
158.3
+158.3
0.0%
jan 1, 1975
209.3
+51.0
32.22%
jan 1, 1976
230.2
+20.9
9.99%
jan 1, 1977
276.2
+46.0
19.98%
jan 1, 1978
282.1
+5.9
2.14%
jan 1, 1979
298.6
+16.5
5.85%
jan 1, 1980
388.6
+90.0
30.14%
jan 1, 1981
375.3
-13.3
-3.42%
jan 1, 1982
395.1
+19.8
5.28%
jan 1, 1983
395.2
+0.1
0.03%
jan 1, 1984
400.6
+5.4
1.37%
jan 1, 1985
425.4
+24.8
6.19%
jan 1, 1986
478.2
+52.8
12.41%
jan 1, 1987
466.9
-11.3
-2.36%
jan 1, 1988
522.9
+56.0
11.99%
jan 1, 1989
537.2
+14.3
2.73%
jan 1, 1990
589.3
+52.1
9.7%
jan 1, 1991
531.6
-57.7
-9.79%
jan 1, 1992
501.0
-30.6
-5.76%
jan 1, 1993
480.7
-20.3
-4.05%
jan 1, 1994
424.2
-56.5
-11.75%
jan 1, 1995
612.9
+188.7
44.48%
jan 1, 1996
583.8
-29.1
-4.75%
jan 1, 1997
563.4
-20.4
-3.49%
jan 1, 1998
634.7
+71.3
12.66%
jan 1, 1999
521.8
-112.9
-17.79%
jan 1, 2000
543.2
+21.4
4.1%
jan 1, 2001
586.406
+43.206
7.95%
jan 1, 2002
493.39
-93.016
-15.86%
jan 1, 2003
441.484
-51.906
-10.52%
jan 1, 2004
475.266
+33.782
7.65%
jan 1, 2005
534.741
+59.475
12.51%
jan 1, 2006
570.586
+35.845
6.7%
jan 1, 2007
633.773
+63.187
11.07%
jan 1, 2008
498.911
-134.862
-21.28%
jan 1, 2009
539.068
+40.157
8.05%
jan 1, 2010
628.931
+89.863
16.67%
jan 1, 2011
851.469
+222.538
35.38%
jan 1, 2012
971.155
+119.685
14.06%
jan 1, 2013
1.202K
+230.807
23.77%
jan 1, 2014
1.4K
+197.878
16.46%
jan 1, 2015
1.472K
+72.163
5.16%
jan 1, 2016
1.664K
+192.107
13.05%
Ranking of countries by current statistics by years


Comments: