29
/
en
AIzaSyAYiBZKx7MnpbEhh9jyipgxe19OcubqV5w
April 1, 2024
179752
Libya
LBY
true
2
1
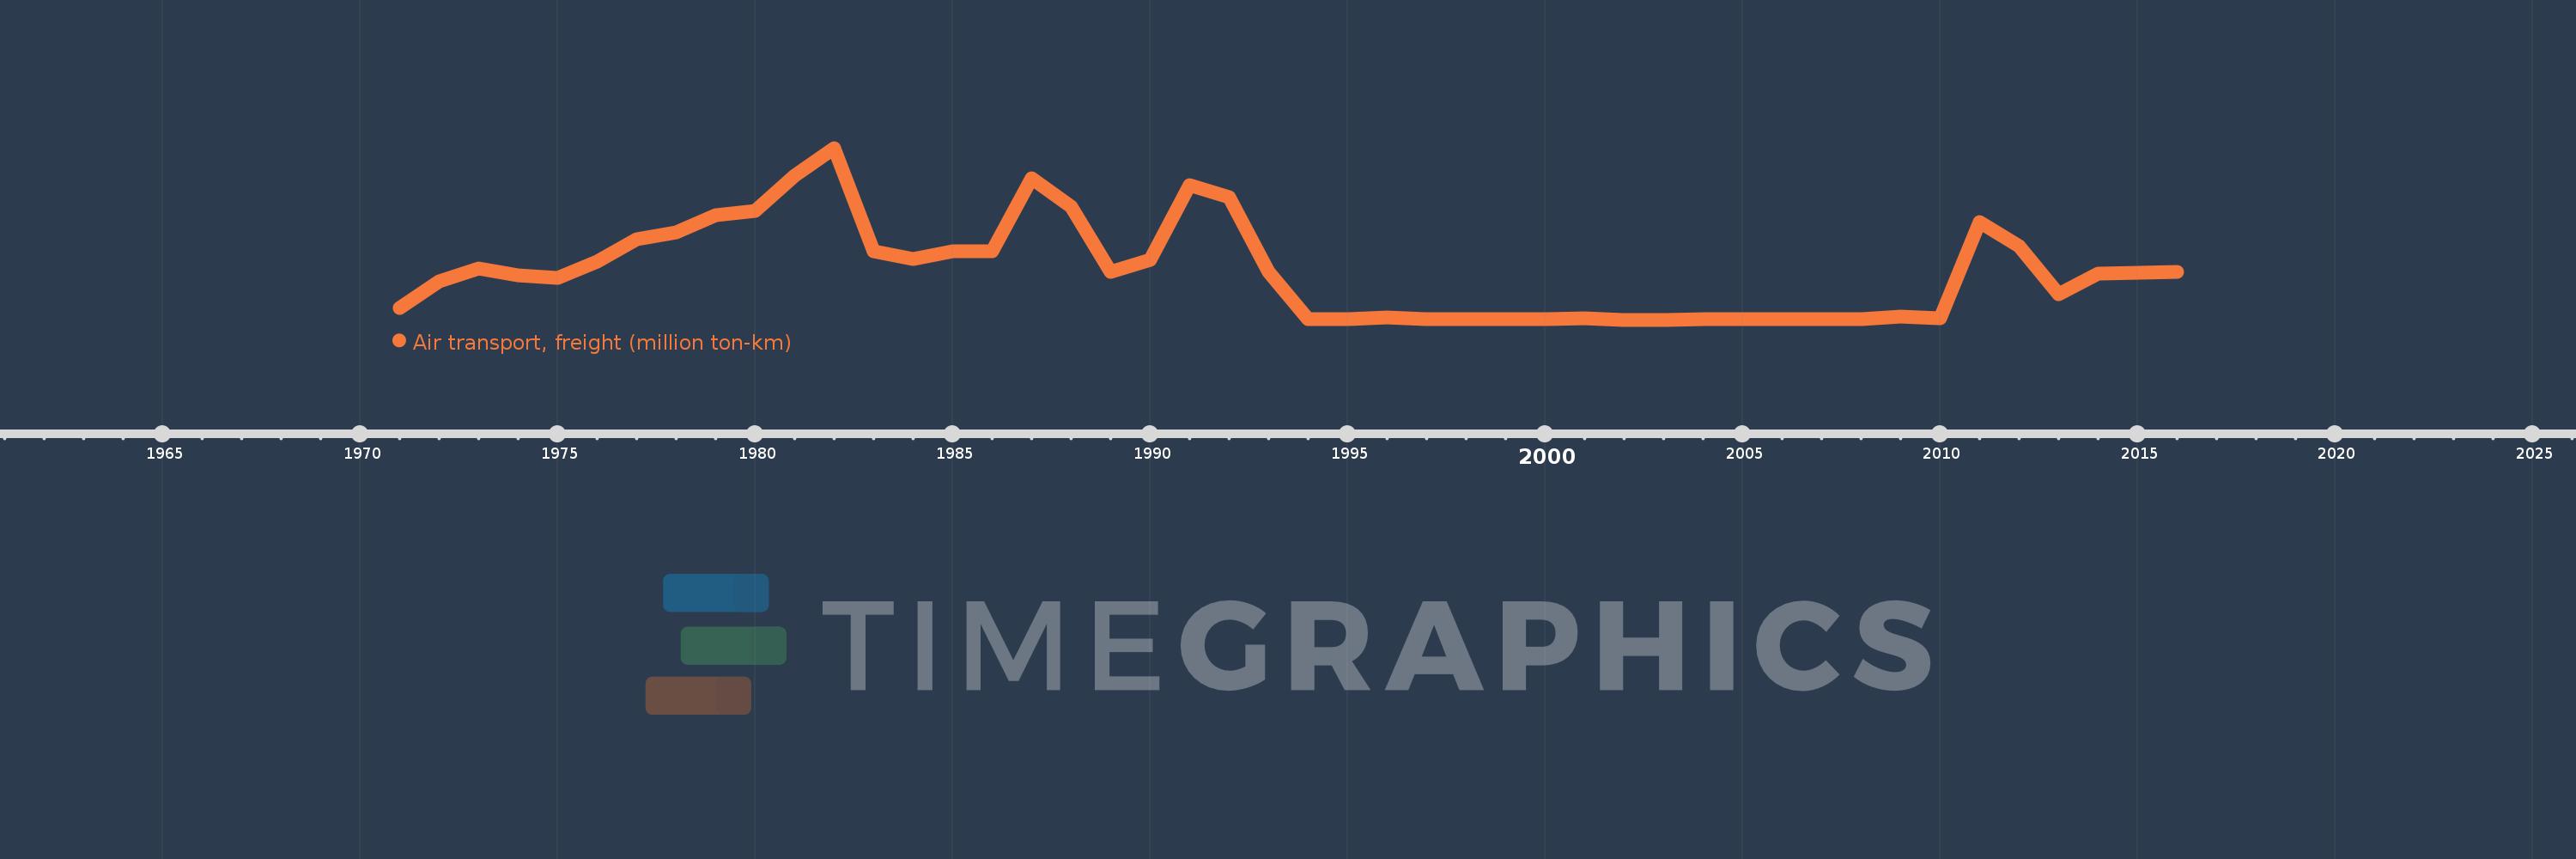
Air transport, freight (million ton-km)
2016,2015,2014,2013,2012,2011,2010,2009,2008,2007,2006,2005,2004,2003,2002,2001,2000,1999,1998,1997,1996,1995,1994,1993,1992,1991,1990,1989,1988,1987,1986,1985,1984,1983,1982,1981,1980,1979,1978,1977,1976,1975,1974,1973,1972,1971
This statistics in other country:
AfghanistanAlbaniaAlgeriaAmerican SamoaAngolaAntigua and BarbudaArab WorldArgentinaArmeniaAustraliaAustriaAzerbaijanBahamas, TheBahrainBangladeshBarbadosBelarusBelgiumBelizeBeninBhutanBoliviaBosnia and HerzegovinaBotswanaBrazilBrunei DarussalamBulgariaBurkina FasoBurundiCabo VerdeCambodiaCameroonCanadaCaribbean small statesCentral African RepublicCentral Europe and the BalticsChadChileChinaColombiaComorosCongo, Dem. Rep.Congo, Rep.Costa RicaCote d'IvoireCroatiaCubaCyprusCzech RepublicDenmarkDjiboutiDominican RepublicEarly-demographic dividendEast Asia & PacificEast Asia & Pacific (excluding high income)East Asia & Pacific (IDA & IBRD countries)EcuadorEgypt, Arab Rep.El SalvadorEquatorial GuineaEritreaEstoniaEthiopiaEuro areaEurope & Central AsiaEurope & Central Asia (excluding high income)Europe & Central Asia (IDA & IBRD countries)European UnionFijiFinlandFragile and conflict affected situationsFranceGabonGambia, TheGeorgiaGermanyGhanaGreeceGuamGuatemalaGuineaGuinea-BissauGuyanaHaitiHeavily indebted poor countries (HIPC)High incomeHondurasHong Kong SAR, ChinaHungaryIBRD onlyIcelandIDA & IBRD totalIDA blendIDA onlyIDA totalIndiaIndonesiaIran, Islamic Rep.IraqIrelandIsraelItalyJamaicaJapanJordanKazakhstanKenyaKiribatiKorea, Dem. People’s Rep.Korea, Rep.KuwaitKyrgyz RepublicLao PDRLate-demographic dividendLatin America & Caribbean Latin America & Caribbean (excluding high income)Latin America & the Caribbean (IDA & IBRD countries)LatviaLeast developed countries: UN classificationLebanonLesothoLiberiaLibyaLithuaniaLow & middle incomeLow incomeLower middle incomeLuxembourgMacao SAR, ChinaMacedonia, FYRMadagascarMalawiMalaysiaMaldivesMaliMaltaMarshall IslandsMauritaniaMauritiusMexicoMiddle East & North AfricaMiddle East & North Africa (excluding high income)Middle East & North Africa (IDA & IBRD countries)Middle incomeMoldovaMonacoMongoliaMontenegroMoroccoMozambiqueMyanmarNamibiaNauruNepalNetherlandsNew ZealandNicaraguaNigerNigeriaNorth AmericaNorwayOECD membersOmanOther small statesPacific island small statesPakistanPanamaPapua New GuineaParaguayPeruPhilippinesPolandPortugalPost-demographic dividendPre-demographic dividendQatarRomaniaRussian FederationRwandaSamoaSao Tome and PrincipeSaudi ArabiaSenegalSerbiaSeychellesSierra LeoneSingaporeSlovak RepublicSloveniaSmall statesSolomon IslandsSomaliaSouth AfricaSouth AsiaSouth Asia (IDA & IBRD)SpainSri LankaSub-Saharan Africa Sub-Saharan Africa (excluding high income)Sub-Saharan Africa (IDA & IBRD countries)SudanSurinameSwazilandSwedenSwitzerlandSyrian Arab RepublicTajikistanTanzaniaThailandTogoTongaTrinidad and TobagoTunisiaTurkeyTurkmenistanUgandaUkraineUnited Arab EmiratesUnited KingdomUnited StatesUpper middle incomeUruguayUzbekistanVanuatuVenezuela, RBVietnamWorldYemen, Rep.ZambiaZimbabwe Timeline:
This timeline shows a graph from 1971 to 2016 of Libya. No data until 1970. Number of actual observations by date: 46.
Source name:
World Development Indicators
Source organization:
International Civil Aviation Organization, Civil Aviation Statistics of the World and ICAO staff estimates.
Categories, topics:
Infrastructure
Last updated:
apr 23, 2017
Indicators value changes by year
At the date of observation
Value
Absolute change
Change from previous value
jan 1, 1972
3.1
+2.0
181.82%
jan 1, 1973
4.1
+1.0
32.26%
jan 1, 1974
3.6
-0.5
-12.2%
jan 1, 1975
3.4
-0.2
-5.56%
jan 1, 1976
4.6
+1.2
35.29%
jan 1, 1977
6.3
+1.7
36.96%
jan 1, 1978
6.8
+0.5
7.94%
jan 1, 1979
8.1
+1.3
19.12%
jan 1, 1981
11.0
+2.6
30.95%
jan 1, 1982
13.1
+2.1
19.09%
jan 1, 1983
5.4
-7.7
-58.78%
jan 1, 1984
4.8
-0.6
-11.11%
jan 1, 1985
5.4
+0.6
12.5%
jan 1, 1987
10.8
+5.4
100.0%
jan 1, 1988
8.7
-2.1
-19.44%
jan 1, 1989
3.8
-4.9
-56.32%
jan 1, 1990
4.7
+0.9
23.68%
jan 1, 1991
10.3
+5.6
119.15%
jan 1, 1992
9.4
-0.9
-8.74%
jan 1, 1993
3.8
-5.6
-59.57%
jan 1, 1994
0.3
-3.5
-92.11%
jan 1, 1996
0.4
+0.1
33.33%
jan 1, 1997
0.3
-0.1
-25.0%
jan 1, 2001
0.328
+0.028
9.33%
jan 1, 2002
0.256
-0.072
-21.95%
jan 1, 2003
0.248
-0.008
-3.13%
jan 1, 2004
0.283
+0.035
14.11%
jan 1, 2005
0.283
0.0
0.0%
jan 1, 2006
0.3
+0.017
6.01%
jan 1, 2007
0.324
+0.024
8.0%
jan 1, 2008
0.288
-0.036
-11.11%
jan 1, 2009
0.464
+0.176
61.11%
jan 1, 2010
0.365
-0.099
-21.34%
jan 1, 2011
7.529
+7.164
1.96K%
jan 1, 2012
5.723
-1.806
-23.98%
jan 1, 2013
2.128
-3.595
-62.81%
jan 1, 2014
3.672
+1.544
72.55%
jan 1, 2015
3.746
+0.074
2.01%
jan 1, 2016
3.834
+0.087
2.33%
Ranking of countries by current statistics by years


Comments: