29
/
en
AIzaSyAYiBZKx7MnpbEhh9jyipgxe19OcubqV5w
April 1, 2024
268945
Turkey
TUR
true
2
1
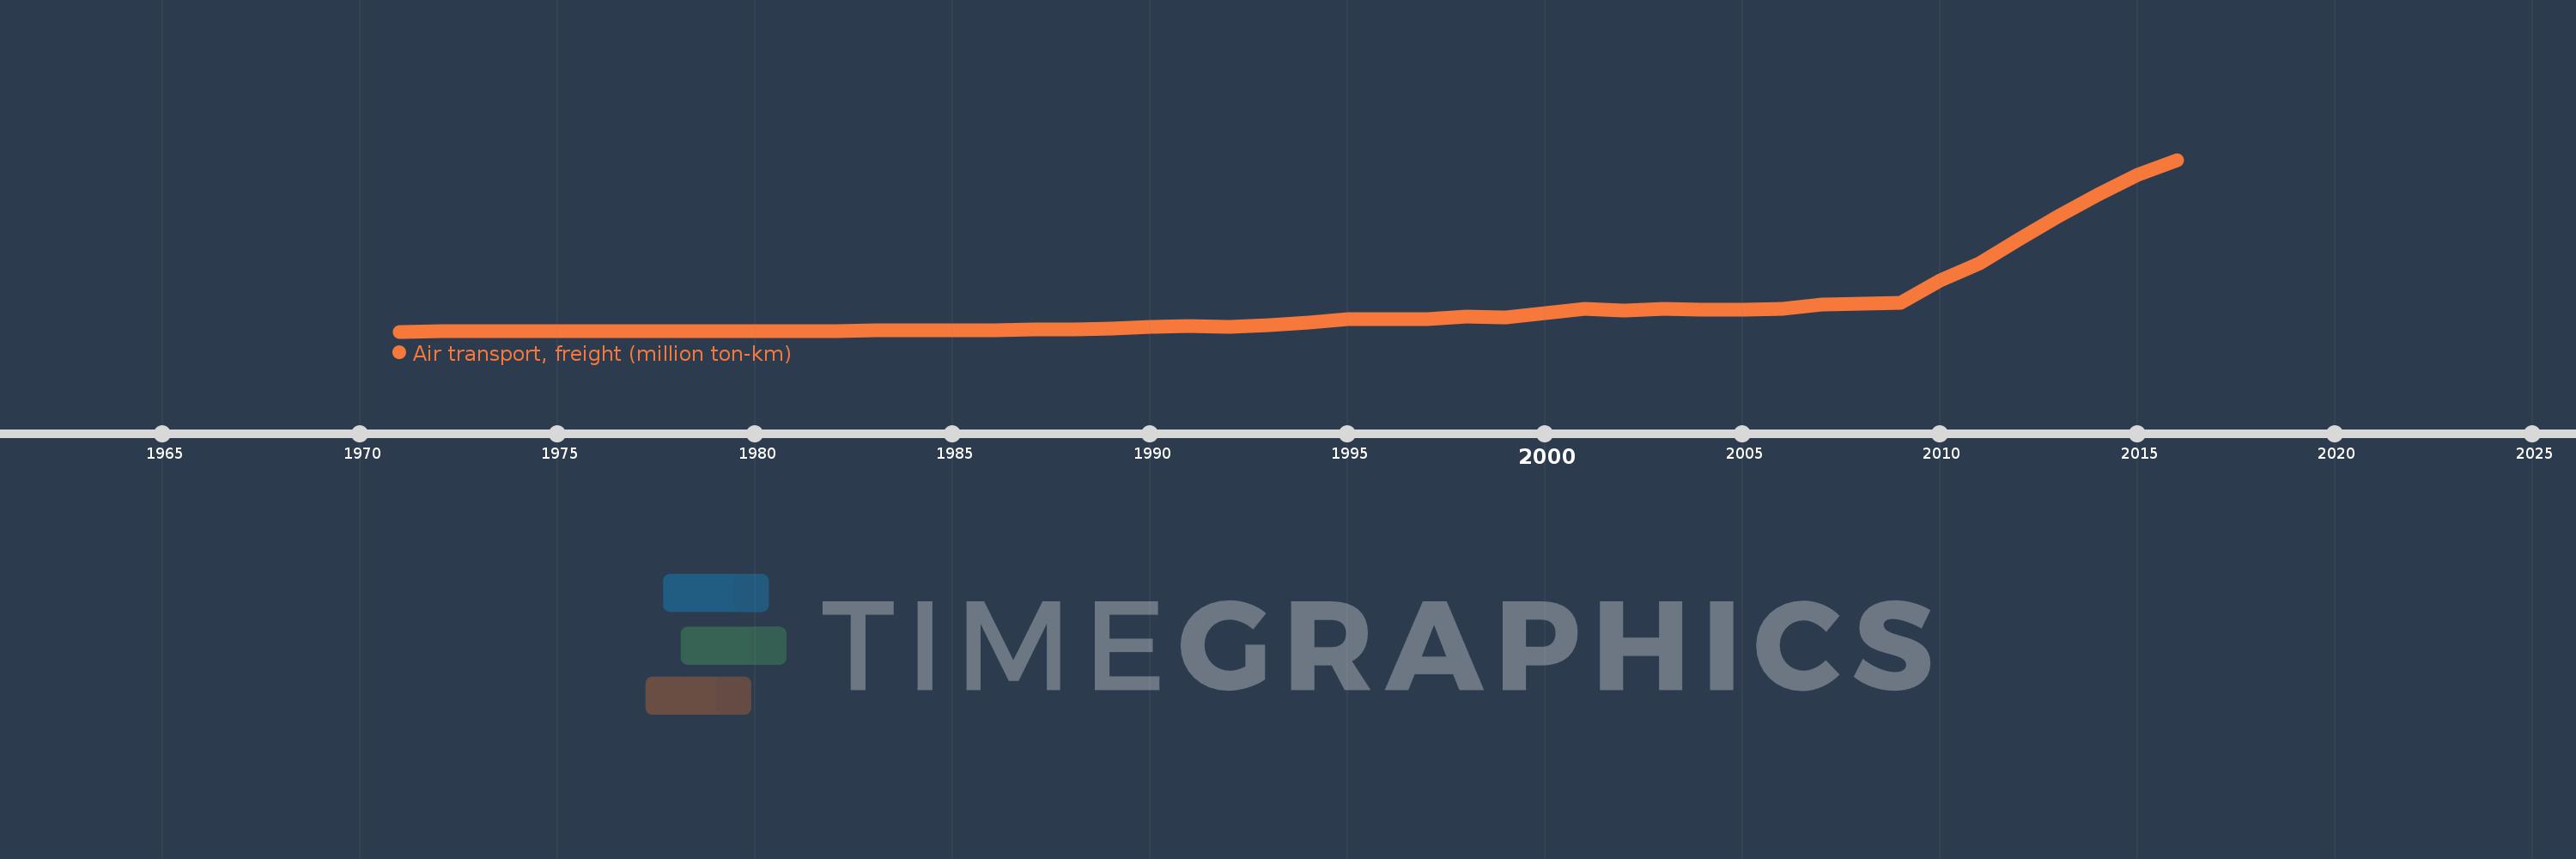
Air transport, freight (million ton-km)
2016,2015,2014,2013,2012,2011,2010,2009,2008,2007,2006,2005,2004,2003,2002,2001,2000,1999,1998,1997,1996,1995,1994,1993,1992,1991,1990,1989,1988,1987,1986,1985,1984,1983,1982,1981,1980,1979,1978,1977,1976,1975,1974,1973,1972,1971
This statistics in other country:
AfghanistanAlbaniaAlgeriaAmerican SamoaAngolaAntigua and BarbudaArab WorldArgentinaArmeniaAustraliaAustriaAzerbaijanBahamas, TheBahrainBangladeshBarbadosBelarusBelgiumBelizeBeninBhutanBoliviaBosnia and HerzegovinaBotswanaBrazilBrunei DarussalamBulgariaBurkina FasoBurundiCabo VerdeCambodiaCameroonCanadaCaribbean small statesCentral African RepublicCentral Europe and the BalticsChadChileChinaColombiaComorosCongo, Dem. Rep.Congo, Rep.Costa RicaCote d'IvoireCroatiaCubaCyprusCzech RepublicDenmarkDjiboutiDominican RepublicEarly-demographic dividendEast Asia & PacificEast Asia & Pacific (excluding high income)East Asia & Pacific (IDA & IBRD countries)EcuadorEgypt, Arab Rep.El SalvadorEquatorial GuineaEritreaEstoniaEthiopiaEuro areaEurope & Central AsiaEurope & Central Asia (excluding high income)Europe & Central Asia (IDA & IBRD countries)European UnionFijiFinlandFragile and conflict affected situationsFranceGabonGambia, TheGeorgiaGermanyGhanaGreeceGuamGuatemalaGuineaGuinea-BissauGuyanaHaitiHeavily indebted poor countries (HIPC)High incomeHondurasHong Kong SAR, ChinaHungaryIBRD onlyIcelandIDA & IBRD totalIDA blendIDA onlyIDA totalIndiaIndonesiaIran, Islamic Rep.IraqIrelandIsraelItalyJamaicaJapanJordanKazakhstanKenyaKiribatiKorea, Dem. People’s Rep.Korea, Rep.KuwaitKyrgyz RepublicLao PDRLate-demographic dividendLatin America & Caribbean Latin America & Caribbean (excluding high income)Latin America & the Caribbean (IDA & IBRD countries)LatviaLeast developed countries: UN classificationLebanonLesothoLiberiaLibyaLithuaniaLow & middle incomeLow incomeLower middle incomeLuxembourgMacao SAR, ChinaMacedonia, FYRMadagascarMalawiMalaysiaMaldivesMaliMaltaMarshall IslandsMauritaniaMauritiusMexicoMiddle East & North AfricaMiddle East & North Africa (excluding high income)Middle East & North Africa (IDA & IBRD countries)Middle incomeMoldovaMonacoMongoliaMontenegroMoroccoMozambiqueMyanmarNamibiaNauruNepalNetherlandsNew ZealandNicaraguaNigerNigeriaNorth AmericaNorwayOECD membersOmanOther small statesPacific island small statesPakistanPanamaPapua New GuineaParaguayPeruPhilippinesPolandPortugalPost-demographic dividendPre-demographic dividendQatarRomaniaRussian FederationRwandaSamoaSao Tome and PrincipeSaudi ArabiaSenegalSerbiaSeychellesSierra LeoneSingaporeSlovak RepublicSloveniaSmall statesSolomon IslandsSomaliaSouth AfricaSouth AsiaSouth Asia (IDA & IBRD)SpainSri LankaSub-Saharan Africa Sub-Saharan Africa (excluding high income)Sub-Saharan Africa (IDA & IBRD countries)SudanSurinameSwazilandSwedenSwitzerlandSyrian Arab RepublicTajikistanTanzaniaThailandTogoTongaTrinidad and TobagoTunisiaTurkeyTurkmenistanUgandaUkraineUnited Arab EmiratesUnited KingdomUnited StatesUpper middle incomeUruguayUzbekistanVanuatuVenezuela, RBVietnamWorldYemen, Rep.ZambiaZimbabwe Timeline:
This timeline shows a graph from 1971 to 2016 of Turkey. No data until 1970. Number of actual observations by date: 46.
Source name:
World Development Indicators
Source organization:
International Civil Aviation Organization, Civil Aviation Statistics of the World and ICAO staff estimates.
Categories, topics:
Infrastructure
Last updated:
apr 23, 2017
Indicators value changes by year
Maximum:
2.882K
jan 1, 2016
At the date of observation
Value
Absolute change
Change from previous value
jan 1, 1972
5.7
+1.1
23.91%
jan 1, 1973
6.8
+1.1
19.3%
jan 1, 1974
10.0
+3.2
47.06%
jan 1, 1975
10.2
+0.2
2.0%
jan 1, 1976
9.7
-0.5
-4.9%
jan 1, 1977
14.3
+4.6
47.42%
jan 1, 1978
15.1
+0.8
5.59%
jan 1, 1979
12.3
-2.8
-18.54%
jan 1, 1980
15.1
+2.8
22.76%
jan 1, 1981
10.3
-4.8
-31.79%
jan 1, 1982
18.2
+7.9
76.7%
jan 1, 1983
22.3
+4.1
22.53%
jan 1, 1984
26.0
+3.7
16.59%
jan 1, 1985
26.3
+0.3
1.15%
jan 1, 1986
28.7
+2.4
9.13%
jan 1, 1987
45.4
+16.7
58.19%
jan 1, 1988
46.9
+1.5
3.3%
jan 1, 1989
52.7
+5.8
12.37%
jan 1, 1990
81.8
+29.1
55.22%
jan 1, 1991
101.3
+19.5
23.84%
jan 1, 1992
78.7
-22.6
-22.31%
jan 1, 1993
117.2
+38.5
48.92%
jan 1, 1994
161.4
+44.2
37.71%
jan 1, 1995
209.6
+48.2
29.86%
jan 1, 1996
214.7
+5.1
2.43%
jan 1, 1997
207.3
-7.4
-3.45%
jan 1, 1998
255.4
+48.1
23.2%
jan 1, 1999
246.6
-8.8
-3.45%
jan 1, 2000
312.9
+66.3
26.89%
jan 1, 2001
385.036
+72.136
23.05%
jan 1, 2002
349.982
-35.054
-9.1%
jan 1, 2003
380.794
+30.812
8.8%
jan 1, 2004
376.657
-4.137
-1.09%
jan 1, 2005
370.182
-6.475
-1.72%
jan 1, 2006
382.949
+12.767
3.45%
jan 1, 2007
463.902
+80.953
21.14%
jan 1, 2008
466.098
+2.196
0.47%
jan 1, 2009
480.667
+14.569
3.13%
jan 1, 2010
856.034
+375.367
78.09%
jan 1, 2011
1.149K
+293.247
34.26%
jan 1, 2012
1.544K
+394.985
34.37%
jan 1, 2013
1.934K
+389.412
25.22%
jan 1, 2014
2.296K
+362.36
18.74%
jan 1, 2015
2.63K
+334.291
14.56%
jan 1, 2016
2.882K
+251.832
9.57%
Ranking of countries by current statistics by years


Comments: