29
/
en
AIzaSyAYiBZKx7MnpbEhh9jyipgxe19OcubqV5w
April 1, 2024
159147
Ireland
IRL
true
2
1
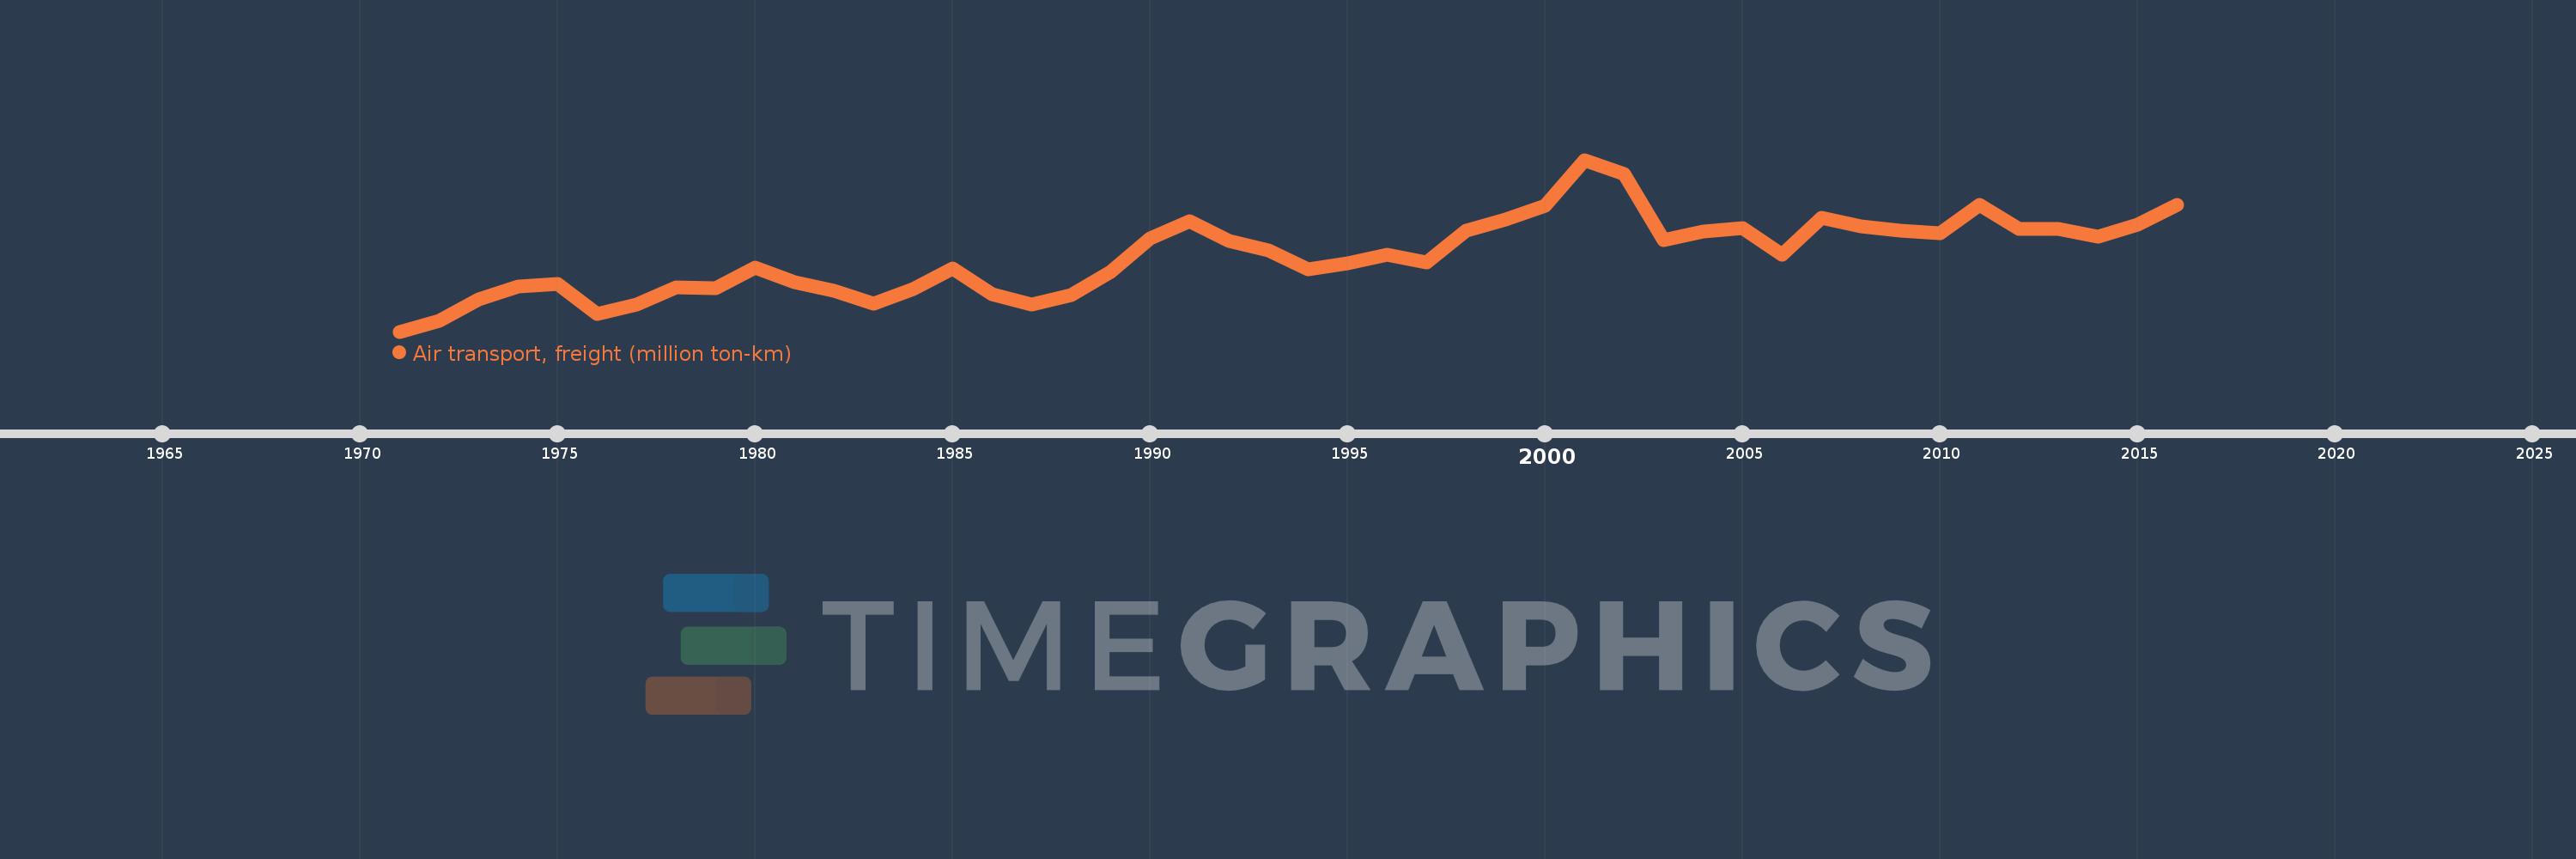
Air transport, freight (million ton-km)
2016,2015,2014,2013,2012,2011,2010,2009,2008,2007,2006,2005,2004,2003,2002,2001,2000,1999,1998,1997,1996,1995,1994,1993,1992,1991,1990,1989,1988,1987,1986,1985,1984,1983,1982,1981,1980,1979,1978,1977,1976,1975,1974,1973,1972,1971
This statistics in other country:
AfghanistanAlbaniaAlgeriaAmerican SamoaAngolaAntigua and BarbudaArab WorldArgentinaArmeniaAustraliaAustriaAzerbaijanBahamas, TheBahrainBangladeshBarbadosBelarusBelgiumBelizeBeninBhutanBoliviaBosnia and HerzegovinaBotswanaBrazilBrunei DarussalamBulgariaBurkina FasoBurundiCabo VerdeCambodiaCameroonCanadaCaribbean small statesCentral African RepublicCentral Europe and the BalticsChadChileChinaColombiaComorosCongo, Dem. Rep.Congo, Rep.Costa RicaCote d'IvoireCroatiaCubaCyprusCzech RepublicDenmarkDjiboutiDominican RepublicEarly-demographic dividendEast Asia & PacificEast Asia & Pacific (excluding high income)East Asia & Pacific (IDA & IBRD countries)EcuadorEgypt, Arab Rep.El SalvadorEquatorial GuineaEritreaEstoniaEthiopiaEuro areaEurope & Central AsiaEurope & Central Asia (excluding high income)Europe & Central Asia (IDA & IBRD countries)European UnionFijiFinlandFragile and conflict affected situationsFranceGabonGambia, TheGeorgiaGermanyGhanaGreeceGuamGuatemalaGuineaGuinea-BissauGuyanaHaitiHeavily indebted poor countries (HIPC)High incomeHondurasHong Kong SAR, ChinaHungaryIBRD onlyIcelandIDA & IBRD totalIDA blendIDA onlyIDA totalIndiaIndonesiaIran, Islamic Rep.IraqIrelandIsraelItalyJamaicaJapanJordanKazakhstanKenyaKiribatiKorea, Dem. People’s Rep.Korea, Rep.KuwaitKyrgyz RepublicLao PDRLate-demographic dividendLatin America & Caribbean Latin America & Caribbean (excluding high income)Latin America & the Caribbean (IDA & IBRD countries)LatviaLeast developed countries: UN classificationLebanonLesothoLiberiaLibyaLithuaniaLow & middle incomeLow incomeLower middle incomeLuxembourgMacao SAR, ChinaMacedonia, FYRMadagascarMalawiMalaysiaMaldivesMaliMaltaMarshall IslandsMauritaniaMauritiusMexicoMiddle East & North AfricaMiddle East & North Africa (excluding high income)Middle East & North Africa (IDA & IBRD countries)Middle incomeMoldovaMonacoMongoliaMontenegroMoroccoMozambiqueMyanmarNamibiaNauruNepalNetherlandsNew ZealandNicaraguaNigerNigeriaNorth AmericaNorwayOECD membersOmanOther small statesPacific island small statesPakistanPanamaPapua New GuineaParaguayPeruPhilippinesPolandPortugalPost-demographic dividendPre-demographic dividendQatarRomaniaRussian FederationRwandaSamoaSao Tome and PrincipeSaudi ArabiaSenegalSerbiaSeychellesSierra LeoneSingaporeSlovak RepublicSloveniaSmall statesSolomon IslandsSomaliaSouth AfricaSouth AsiaSouth Asia (IDA & IBRD)SpainSri LankaSub-Saharan Africa Sub-Saharan Africa (excluding high income)Sub-Saharan Africa (IDA & IBRD countries)SudanSurinameSwazilandSwedenSwitzerlandSyrian Arab RepublicTajikistanTanzaniaThailandTogoTongaTrinidad and TobagoTunisiaTurkeyTurkmenistanUgandaUkraineUnited Arab EmiratesUnited KingdomUnited StatesUpper middle incomeUruguayUzbekistanVanuatuVenezuela, RBVietnamWorldYemen, Rep.ZambiaZimbabwe Timeline:
This timeline shows a graph from 1971 to 2016 of Ireland. No data until 1970. Number of actual observations by date: 46.
Source name:
World Development Indicators
Source organization:
International Civil Aviation Organization, Civil Aviation Statistics of the World and ICAO staff estimates.
Categories, topics:
Infrastructure
Last updated:
apr 23, 2017
Indicators value changes by year
Maximum:
167.595
jan 1, 2001
At the date of observation
Value
Absolute change
Change from previous value
jan 1, 1971
57.7
+57.7
0.0%
jan 1, 1972
64.8
+7.1
12.31%
jan 1, 1973
78.3
+13.5
20.83%
jan 1, 1974
86.8
+8.5
10.86%
jan 1, 1975
88.2
+1.4
1.61%
jan 1, 1976
68.7
-19.5
-22.11%
jan 1, 1977
74.9
+6.2
9.02%
jan 1, 1978
85.8
+10.9
14.55%
jan 1, 1979
85.7
-0.1
-0.12%
jan 1, 1980
98.4
+12.7
14.82%
jan 1, 1981
89.3
-9.1
-9.25%
jan 1, 1982
83.9
-5.4
-6.05%
jan 1, 1983
75.8
-8.1
-9.65%
jan 1, 1984
84.9
+9.1
12.01%
jan 1, 1985
98.1
+13.2
15.55%
jan 1, 1986
81.5
-16.6
-16.92%
jan 1, 1987
75.0
-6.5
-7.98%
jan 1, 1988
80.8
+5.8
7.73%
jan 1, 1989
95.8
+15.0
18.56%
jan 1, 1990
117.5
+21.7
22.65%
jan 1, 1991
128.3
+10.8
9.19%
jan 1, 1992
115.4
-12.9
-10.05%
jan 1, 1993
109.5
-5.9
-5.11%
jan 1, 1994
97.4
-12.1
-11.05%
jan 1, 1995
101.2
+3.8
3.9%
jan 1, 1996
107.0
+5.8
5.73%
jan 1, 1997
102.1
-4.9
-4.58%
jan 1, 1998
122.1
+20.0
19.59%
jan 1, 1999
129.6
+7.5
6.14%
jan 1, 2000
138.0
+8.4
6.48%
jan 1, 2001
167.595
+29.595
21.45%
jan 1, 2002
158.778
-8.817
-5.26%
jan 1, 2003
116.063
-42.715
-26.9%
jan 1, 2004
121.788
+5.725
4.93%
jan 1, 2005
124.11
+2.322
1.91%
jan 1, 2006
106.997
-17.113
-13.79%
jan 1, 2007
130.503
+23.506
21.97%
jan 1, 2008
125.283
-5.22
-4.0%
jan 1, 2009
122.241
-3.042
-2.43%
jan 1, 2010
120.852
-1.389
-1.14%
jan 1, 2011
138.475
+17.623
14.58%
jan 1, 2012
123.452
-15.023
-10.85%
jan 1, 2013
123.11
-0.342
-0.28%
jan 1, 2014
118.254
-4.856
-3.94%
jan 1, 2015
126.165
+7.911
6.69%
jan 1, 2016
138.58
+12.415
9.84%
Ranking of countries by current statistics by years


Comments: