29
/
en
AIzaSyAYiBZKx7MnpbEhh9jyipgxe19OcubqV5w
April 1, 2024
167102
Kenya
KEN
true
2
1
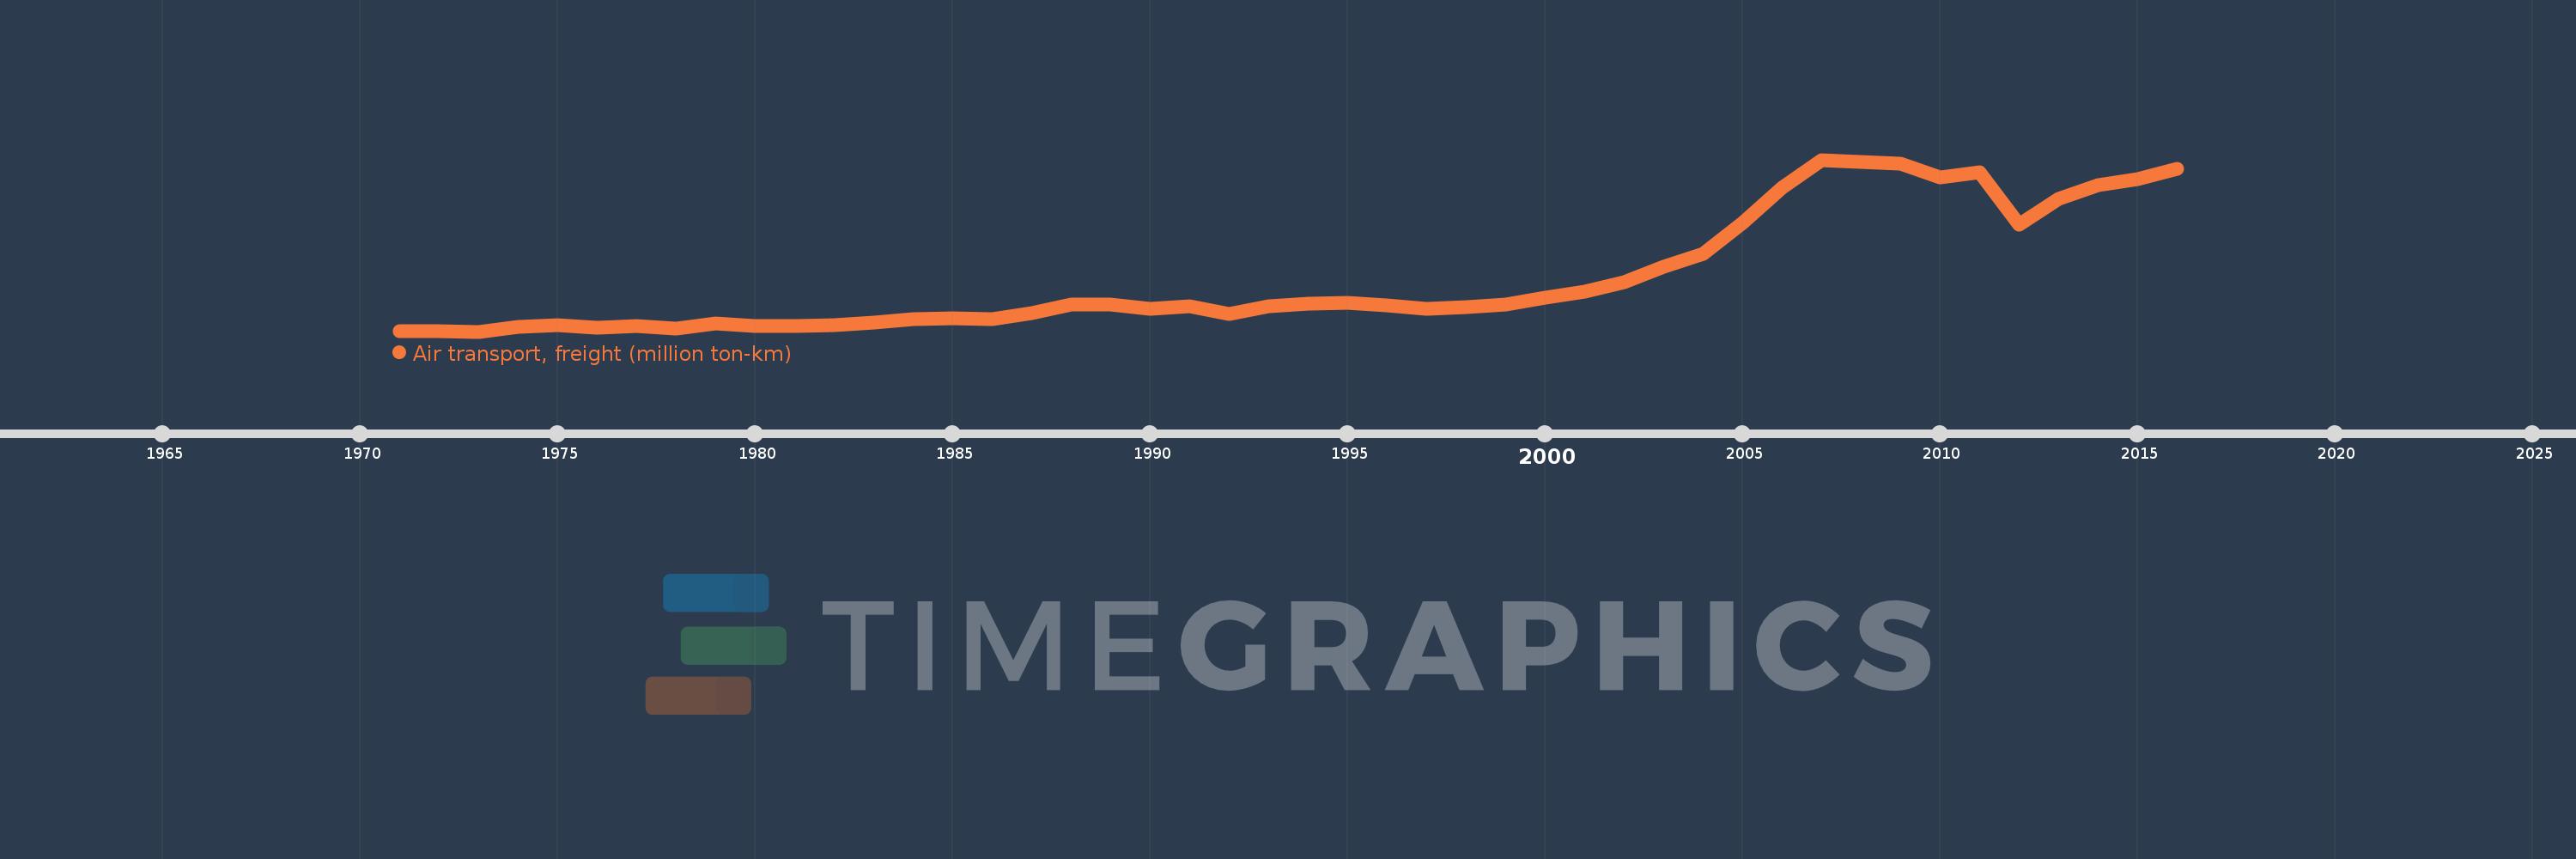
Air transport, freight (million ton-km)
2016,2015,2014,2013,2012,2011,2010,2009,2008,2007,2006,2005,2004,2003,2002,2001,2000,1999,1998,1997,1996,1995,1994,1993,1992,1991,1990,1989,1988,1987,1986,1985,1984,1983,1982,1981,1980,1979,1978,1977,1976,1975,1974,1973,1972,1971
This statistics in other country:
AfghanistanAlbaniaAlgeriaAmerican SamoaAngolaAntigua and BarbudaArab WorldArgentinaArmeniaAustraliaAustriaAzerbaijanBahamas, TheBahrainBangladeshBarbadosBelarusBelgiumBelizeBeninBhutanBoliviaBosnia and HerzegovinaBotswanaBrazilBrunei DarussalamBulgariaBurkina FasoBurundiCabo VerdeCambodiaCameroonCanadaCaribbean small statesCentral African RepublicCentral Europe and the BalticsChadChileChinaColombiaComorosCongo, Dem. Rep.Congo, Rep.Costa RicaCote d'IvoireCroatiaCubaCyprusCzech RepublicDenmarkDjiboutiDominican RepublicEarly-demographic dividendEast Asia & PacificEast Asia & Pacific (excluding high income)East Asia & Pacific (IDA & IBRD countries)EcuadorEgypt, Arab Rep.El SalvadorEquatorial GuineaEritreaEstoniaEthiopiaEuro areaEurope & Central AsiaEurope & Central Asia (excluding high income)Europe & Central Asia (IDA & IBRD countries)European UnionFijiFinlandFragile and conflict affected situationsFranceGabonGambia, TheGeorgiaGermanyGhanaGreeceGuamGuatemalaGuineaGuinea-BissauGuyanaHaitiHeavily indebted poor countries (HIPC)High incomeHondurasHong Kong SAR, ChinaHungaryIBRD onlyIcelandIDA & IBRD totalIDA blendIDA onlyIDA totalIndiaIndonesiaIran, Islamic Rep.IraqIrelandIsraelItalyJamaicaJapanJordanKazakhstanKenyaKiribatiKorea, Dem. People’s Rep.Korea, Rep.KuwaitKyrgyz RepublicLao PDRLate-demographic dividendLatin America & Caribbean Latin America & Caribbean (excluding high income)Latin America & the Caribbean (IDA & IBRD countries)LatviaLeast developed countries: UN classificationLebanonLesothoLiberiaLibyaLithuaniaLow & middle incomeLow incomeLower middle incomeLuxembourgMacao SAR, ChinaMacedonia, FYRMadagascarMalawiMalaysiaMaldivesMaliMaltaMarshall IslandsMauritaniaMauritiusMexicoMiddle East & North AfricaMiddle East & North Africa (excluding high income)Middle East & North Africa (IDA & IBRD countries)Middle incomeMoldovaMonacoMongoliaMontenegroMoroccoMozambiqueMyanmarNamibiaNauruNepalNetherlandsNew ZealandNicaraguaNigerNigeriaNorth AmericaNorwayOECD membersOmanOther small statesPacific island small statesPakistanPanamaPapua New GuineaParaguayPeruPhilippinesPolandPortugalPost-demographic dividendPre-demographic dividendQatarRomaniaRussian FederationRwandaSamoaSao Tome and PrincipeSaudi ArabiaSenegalSerbiaSeychellesSierra LeoneSingaporeSlovak RepublicSloveniaSmall statesSolomon IslandsSomaliaSouth AfricaSouth AsiaSouth Asia (IDA & IBRD)SpainSri LankaSub-Saharan Africa Sub-Saharan Africa (excluding high income)Sub-Saharan Africa (IDA & IBRD countries)SudanSurinameSwazilandSwedenSwitzerlandSyrian Arab RepublicTajikistanTanzaniaThailandTogoTongaTrinidad and TobagoTunisiaTurkeyTurkmenistanUgandaUkraineUnited Arab EmiratesUnited KingdomUnited StatesUpper middle incomeUruguayUzbekistanVanuatuVenezuela, RBVietnamWorldYemen, Rep.ZambiaZimbabwe Timeline:
This timeline shows a graph from 1971 to 2016 of Kenya. No data until 1970. Number of actual observations by date: 46.
Source name:
World Development Indicators
Source organization:
International Civil Aviation Organization, Civil Aviation Statistics of the World and ICAO staff estimates.
Categories, topics:
Infrastructure
Last updated:
apr 23, 2017
Indicators value changes by year
Maximum:
301.219
jan 1, 2007
At the date of observation
Value
Absolute change
Change from previous value
jan 1, 1972
9.2
-0.2
-2.13%
jan 1, 1973
8.5
-0.7
-7.61%
jan 1, 1974
17.0
+8.5
100.0%
jan 1, 1975
19.0
+2.0
11.76%
jan 1, 1976
15.7
-3.3
-17.37%
jan 1, 1977
17.9
+2.2
14.01%
jan 1, 1978
14.2
-3.7
-20.67%
jan 1, 1979
22.1
+7.9
55.63%
jan 1, 1980
18.5
-3.6
-16.29%
jan 1, 1981
18.0
-0.5
-2.7%
jan 1, 1982
19.1
+1.1
6.11%
jan 1, 1983
23.4
+4.3
22.51%
jan 1, 1984
30.3
+6.9
29.49%
jan 1, 1985
31.5
+1.2
3.96%
jan 1, 1986
30.4
-1.1
-3.49%
jan 1, 1987
39.3
+8.9
29.28%
jan 1, 1988
54.3
+15.0
38.17%
jan 1, 1989
55.2
+0.9
1.66%
jan 1, 1990
47.7
-7.5
-13.59%
jan 1, 1991
52.2
+4.5
9.43%
jan 1, 1992
39.2
-13.0
-24.9%
jan 1, 1993
51.0
+11.8
30.1%
jan 1, 1994
56.1
+5.1
10.0%
jan 1, 1995
57.2
+1.1
1.96%
jan 1, 1996
52.8
-4.4
-7.69%
jan 1, 1997
47.8
-5.0
-9.47%
jan 1, 1998
50.8
+3.0
6.28%
jan 1, 1999
53.9
+3.1
6.1%
jan 1, 2000
65.6
+11.7
21.71%
jan 1, 2001
77.045
+11.445
17.45%
jan 1, 2002
92.732
+15.687
20.36%
jan 1, 2003
118.382
+25.65
27.66%
jan 1, 2004
141.539
+23.157
19.56%
jan 1, 2005
193.459
+51.92
36.68%
jan 1, 2006
253.163
+59.704
30.86%
jan 1, 2007
301.219
+48.056
18.98%
jan 1, 2008
298.083
-3.136
-1.04%
jan 1, 2009
295.183
-2.9
-0.97%
jan 1, 2010
271.562
-23.621
-8.0%
jan 1, 2011
279.991
+8.429
3.1%
jan 1, 2012
191.161
-88.83
-31.73%
jan 1, 2013
234.569
+43.408
22.71%
jan 1, 2014
258.081
+23.512
10.02%
jan 1, 2015
268.867
+10.786
4.18%
jan 1, 2016
286.415
+17.548
6.53%
Ranking of countries by current statistics by years


Comments: