29
/
en
AIzaSyAYiBZKx7MnpbEhh9jyipgxe19OcubqV5w
April 1, 2024
187452
Malaysia
MYS
true
2
1
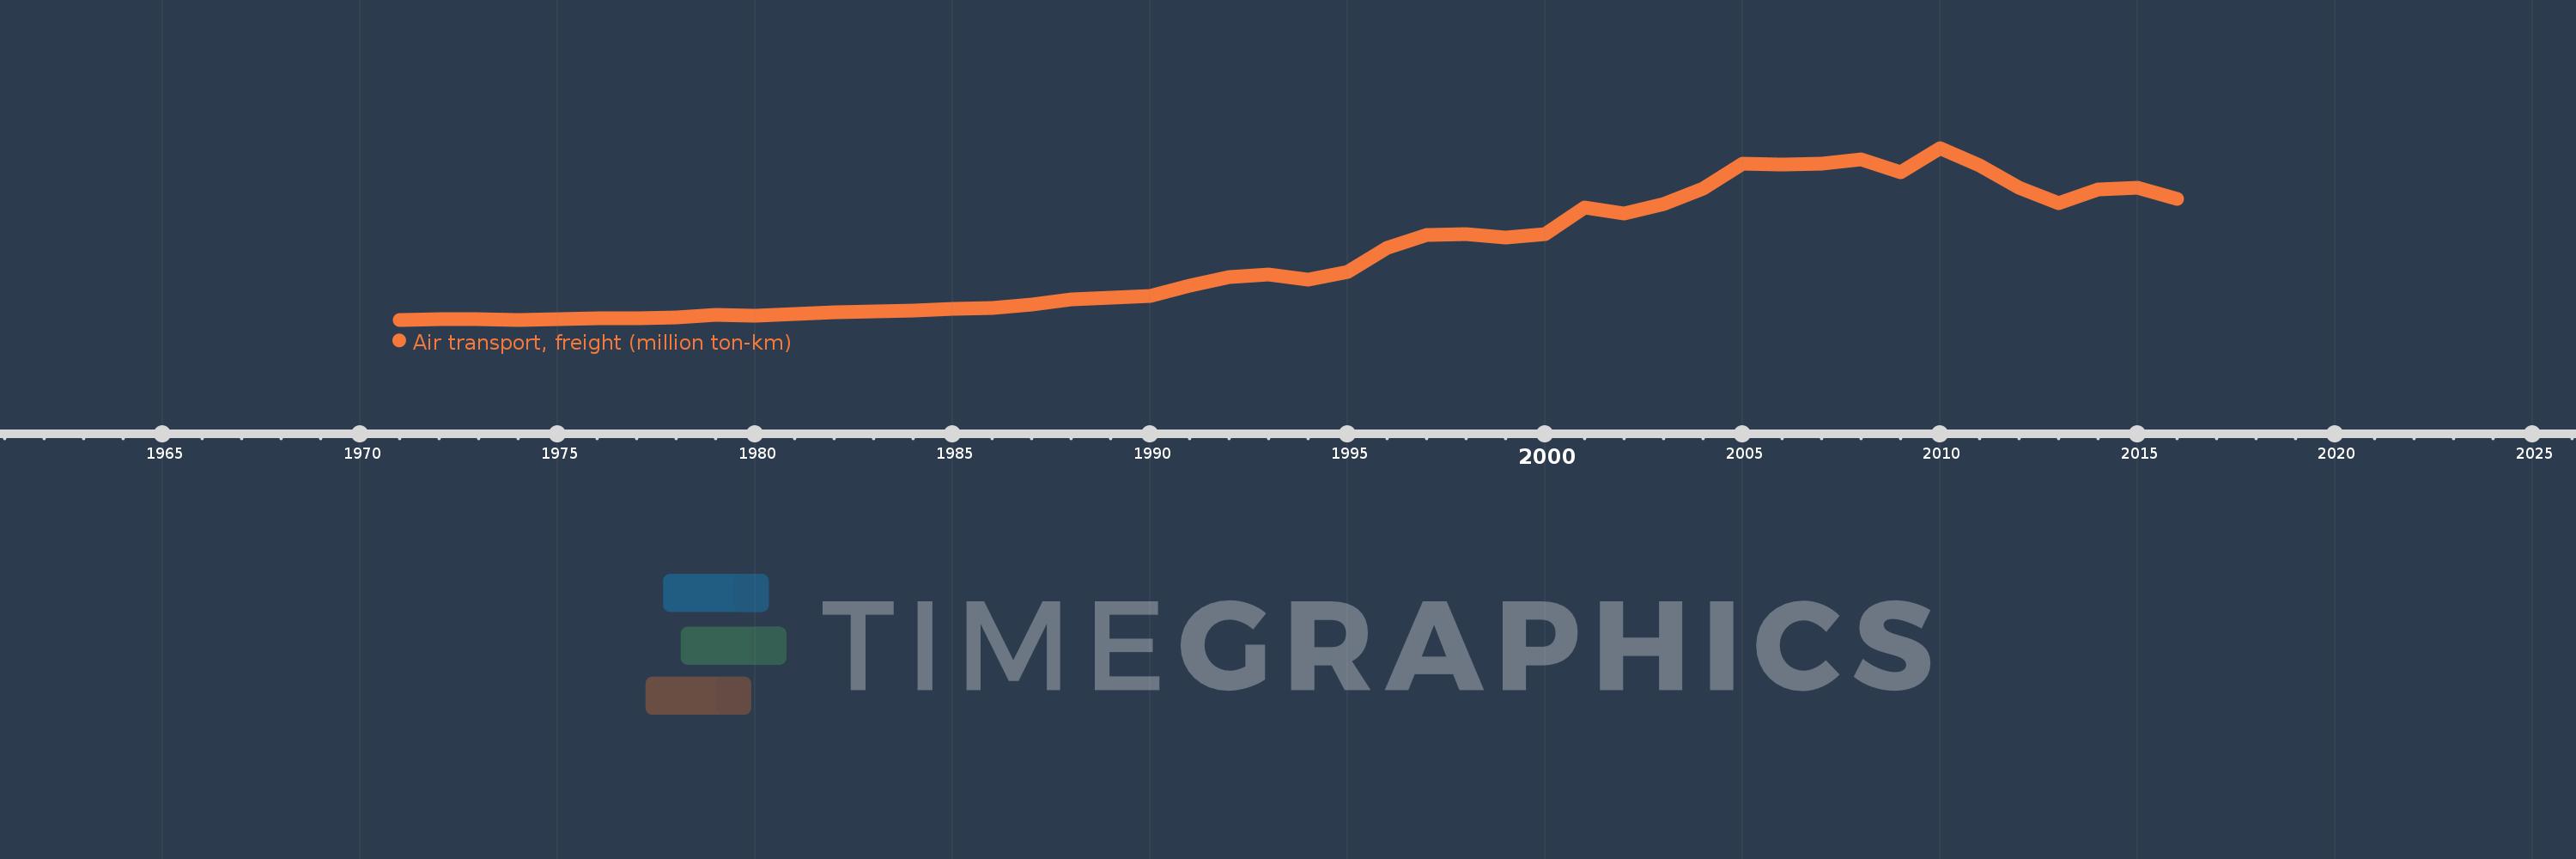
Air transport, freight (million ton-km)
2016,2015,2014,2013,2012,2011,2010,2009,2008,2007,2006,2005,2004,2003,2002,2001,2000,1999,1998,1997,1996,1995,1994,1993,1992,1991,1990,1989,1988,1987,1986,1985,1984,1983,1982,1981,1980,1979,1978,1977,1976,1975,1974,1973,1972,1971
This statistics in other country:
AfghanistanAlbaniaAlgeriaAmerican SamoaAngolaAntigua and BarbudaArab WorldArgentinaArmeniaAustraliaAustriaAzerbaijanBahamas, TheBahrainBangladeshBarbadosBelarusBelgiumBelizeBeninBhutanBoliviaBosnia and HerzegovinaBotswanaBrazilBrunei DarussalamBulgariaBurkina FasoBurundiCabo VerdeCambodiaCameroonCanadaCaribbean small statesCentral African RepublicCentral Europe and the BalticsChadChileChinaColombiaComorosCongo, Dem. Rep.Congo, Rep.Costa RicaCote d'IvoireCroatiaCubaCyprusCzech RepublicDenmarkDjiboutiDominican RepublicEarly-demographic dividendEast Asia & PacificEast Asia & Pacific (excluding high income)East Asia & Pacific (IDA & IBRD countries)EcuadorEgypt, Arab Rep.El SalvadorEquatorial GuineaEritreaEstoniaEthiopiaEuro areaEurope & Central AsiaEurope & Central Asia (excluding high income)Europe & Central Asia (IDA & IBRD countries)European UnionFijiFinlandFragile and conflict affected situationsFranceGabonGambia, TheGeorgiaGermanyGhanaGreeceGuamGuatemalaGuineaGuinea-BissauGuyanaHaitiHeavily indebted poor countries (HIPC)High incomeHondurasHong Kong SAR, ChinaHungaryIBRD onlyIcelandIDA & IBRD totalIDA blendIDA onlyIDA totalIndiaIndonesiaIran, Islamic Rep.IraqIrelandIsraelItalyJamaicaJapanJordanKazakhstanKenyaKiribatiKorea, Dem. People’s Rep.Korea, Rep.KuwaitKyrgyz RepublicLao PDRLate-demographic dividendLatin America & Caribbean Latin America & Caribbean (excluding high income)Latin America & the Caribbean (IDA & IBRD countries)LatviaLeast developed countries: UN classificationLebanonLesothoLiberiaLibyaLithuaniaLow & middle incomeLow incomeLower middle incomeLuxembourgMacao SAR, ChinaMacedonia, FYRMadagascarMalawiMalaysiaMaldivesMaliMaltaMarshall IslandsMauritaniaMauritiusMexicoMiddle East & North AfricaMiddle East & North Africa (excluding high income)Middle East & North Africa (IDA & IBRD countries)Middle incomeMoldovaMonacoMongoliaMontenegroMoroccoMozambiqueMyanmarNamibiaNauruNepalNetherlandsNew ZealandNicaraguaNigerNigeriaNorth AmericaNorwayOECD membersOmanOther small statesPacific island small statesPakistanPanamaPapua New GuineaParaguayPeruPhilippinesPolandPortugalPost-demographic dividendPre-demographic dividendQatarRomaniaRussian FederationRwandaSamoaSao Tome and PrincipeSaudi ArabiaSenegalSerbiaSeychellesSierra LeoneSingaporeSlovak RepublicSloveniaSmall statesSolomon IslandsSomaliaSouth AfricaSouth AsiaSouth Asia (IDA & IBRD)SpainSri LankaSub-Saharan Africa Sub-Saharan Africa (excluding high income)Sub-Saharan Africa (IDA & IBRD countries)SudanSurinameSwazilandSwedenSwitzerlandSyrian Arab RepublicTajikistanTanzaniaThailandTogoTongaTrinidad and TobagoTunisiaTurkeyTurkmenistanUgandaUkraineUnited Arab EmiratesUnited KingdomUnited StatesUpper middle incomeUruguayUzbekistanVanuatuVenezuela, RBVietnamWorldYemen, Rep.ZambiaZimbabwe Timeline:
This timeline shows a graph from 1971 to 2016 of Malaysia. No data until 1970. Number of actual observations by date: 46.
Source name:
World Development Indicators
Source organization:
International Civil Aviation Organization, Civil Aviation Statistics of the World and ICAO staff estimates.
Categories, topics:
Infrastructure
Last updated:
apr 23, 2017
Indicators value changes by year
Maximum:
2.853K
jan 1, 2010
At the date of observation
Value
Absolute change
Change from previous value
jan 1, 1972
14.6
+5.3
56.99%
jan 1, 1973
16.2
+1.6
10.96%
jan 1, 1974
8.3
-7.9
-48.77%
jan 1, 1975
19.1
+10.8
130.12%
jan 1, 1976
26.8
+7.7
40.31%
jan 1, 1977
33.4
+6.6
24.63%
jan 1, 1978
45.0
+11.6
34.73%
jan 1, 1979
82.3
+37.3
82.89%
jan 1, 1980
68.7
-13.6
-16.52%
jan 1, 1981
109.9
+41.2
59.97%
jan 1, 1982
130.3
+20.4
18.56%
jan 1, 1983
141.3
+11.0
8.44%
jan 1, 1984
163.1
+21.8
15.43%
jan 1, 1985
192.6
+29.5
18.09%
jan 1, 1986
200.5
+7.9
4.1%
jan 1, 1987
259.3
+58.8
29.33%
jan 1, 1988
343.4
+84.1
32.43%
jan 1, 1989
373.2
+29.8
8.68%
jan 1, 1990
403.7
+30.5
8.17%
jan 1, 1991
574.2
+170.5
42.23%
jan 1, 1992
713.6
+139.4
24.28%
jan 1, 1993
763.7
+50.1
7.02%
jan 1, 1994
677.8
-85.9
-11.25%
jan 1, 1995
797.1
+119.3
17.6%
jan 1, 1996
1.199K
+401.7
50.4%
jan 1, 1997
1.415K
+215.8
18.0%
jan 1, 1998
1.426K
+11.1
0.78%
jan 1, 1999
1.376K
-50.1
-3.51%
jan 1, 2000
1.425K
+49.0
3.56%
jan 1, 2001
1.864K
+439.241
30.83%
jan 1, 2002
1.775K
-89.096
-4.78%
jan 1, 2003
1.924K
+148.91
8.39%
jan 1, 2004
2.179K
+254.855
13.25%
jan 1, 2005
2.599K
+420.655
19.31%
jan 1, 2006
2.578K
-21.584
-0.83%
jan 1, 2007
2.597K
+19.823
0.77%
jan 1, 2008
2.662K
+64.124
2.47%
jan 1, 2009
2.444K
-217.066
-8.16%
jan 1, 2010
2.853K
+408.801
16.72%
jan 1, 2011
2.565K
-288.605
-10.11%
jan 1, 2012
2.193K
-371.398
-14.48%
jan 1, 2013
1.944K
-249.301
-11.37%
jan 1, 2014
2.162K
+218.034
11.22%
jan 1, 2015
2.193K
+31.308
1.45%
jan 1, 2016
2.006K
-187.321
-8.54%
Ranking of countries by current statistics by years


Comments: