29
/
en
AIzaSyAYiBZKx7MnpbEhh9jyipgxe19OcubqV5w
April 1, 2024
215010
Oman
OMN
true
2
1
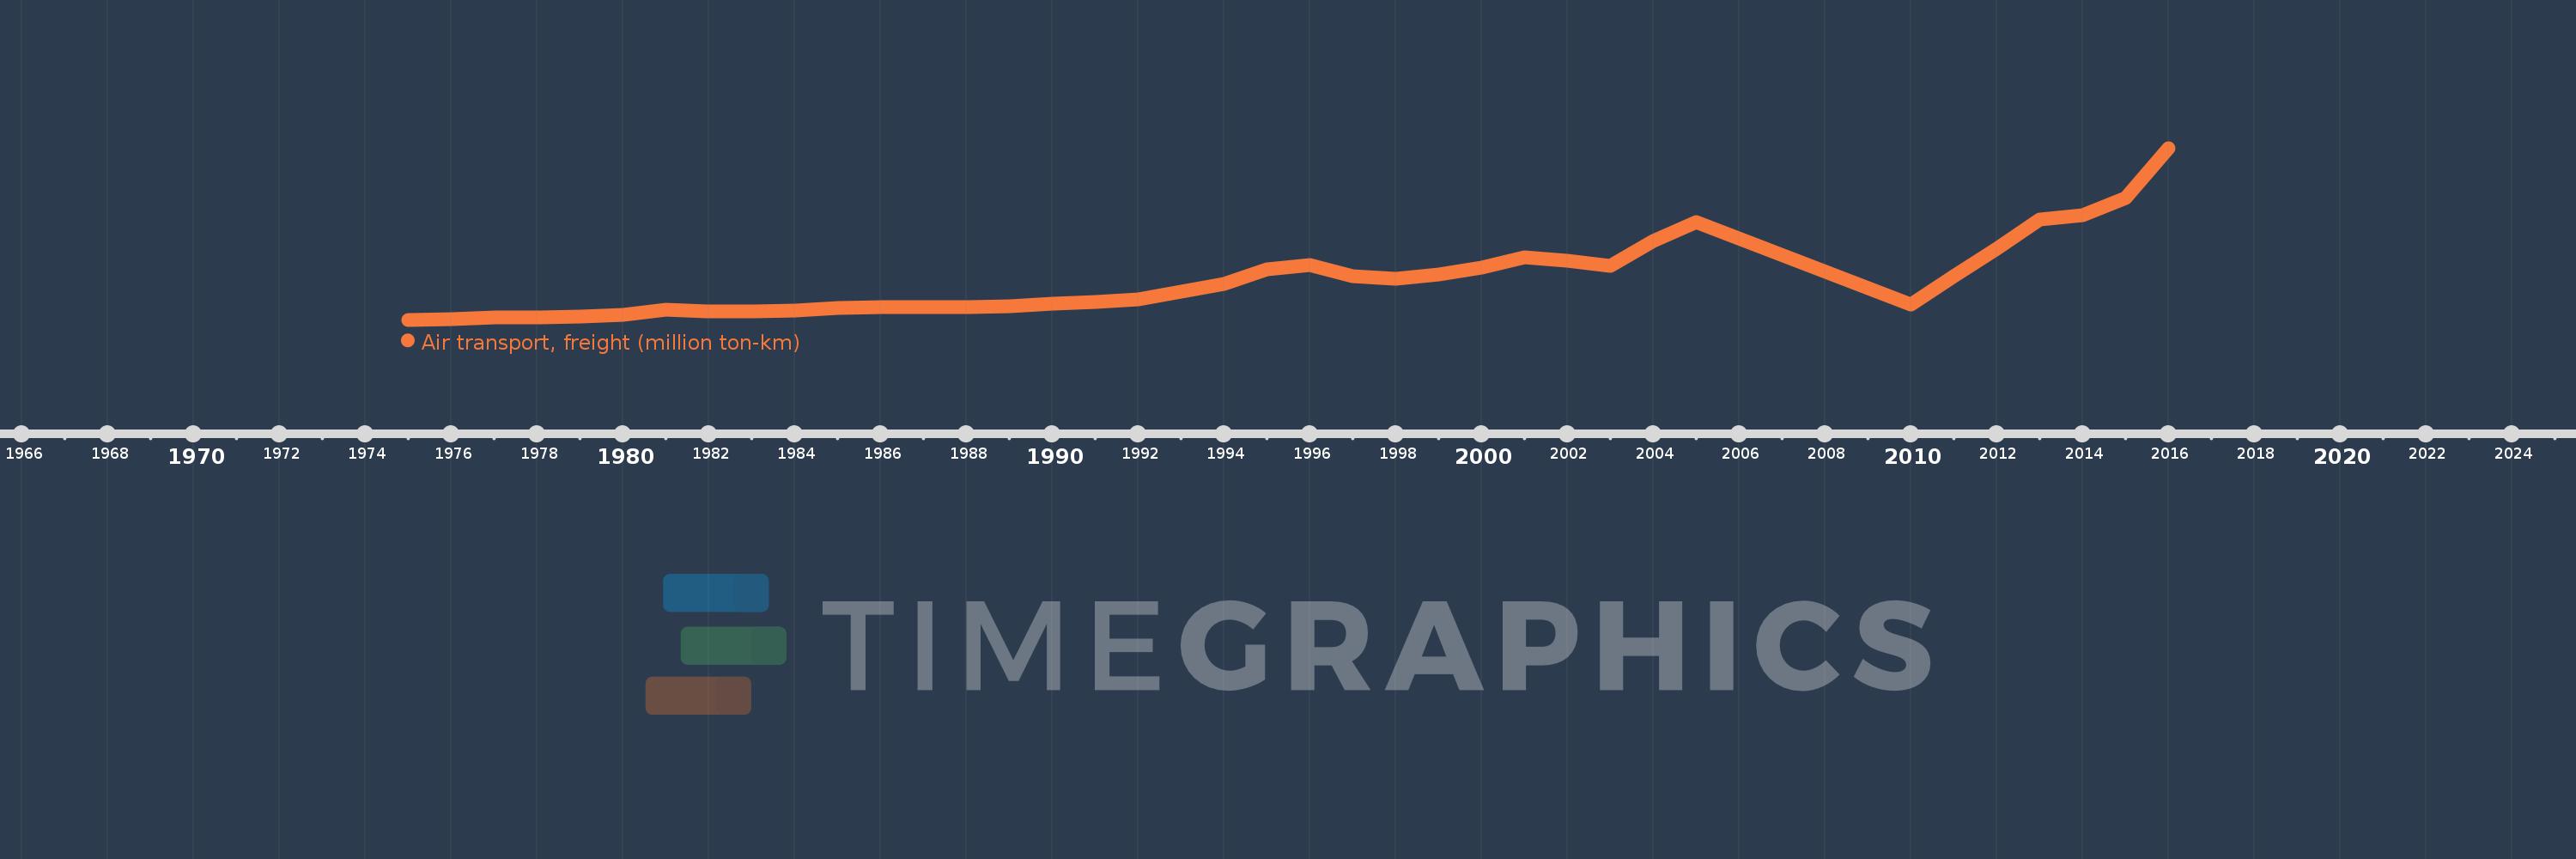
Air transport, freight (million ton-km)
2016,2015,2014,2013,2012,2011,2010,2005,2004,2003,2002,2001,2000,1999,1998,1997,1996,1995,1994,1993,1992,1991,1990,1989,1988,1987,1986,1985,1984,1983,1982,1981,1980,1979,1978,1977,1976,1975
This statistics in other country:
AfghanistanAlbaniaAlgeriaAmerican SamoaAngolaAntigua and BarbudaArab WorldArgentinaArmeniaAustraliaAustriaAzerbaijanBahamas, TheBahrainBangladeshBarbadosBelarusBelgiumBelizeBeninBhutanBoliviaBosnia and HerzegovinaBotswanaBrazilBrunei DarussalamBulgariaBurkina FasoBurundiCabo VerdeCambodiaCameroonCanadaCaribbean small statesCentral African RepublicCentral Europe and the BalticsChadChileChinaColombiaComorosCongo, Dem. Rep.Congo, Rep.Costa RicaCote d'IvoireCroatiaCubaCyprusCzech RepublicDenmarkDjiboutiDominican RepublicEarly-demographic dividendEast Asia & PacificEast Asia & Pacific (excluding high income)East Asia & Pacific (IDA & IBRD countries)EcuadorEgypt, Arab Rep.El SalvadorEquatorial GuineaEritreaEstoniaEthiopiaEuro areaEurope & Central AsiaEurope & Central Asia (excluding high income)Europe & Central Asia (IDA & IBRD countries)European UnionFijiFinlandFragile and conflict affected situationsFranceGabonGambia, TheGeorgiaGermanyGhanaGreeceGuamGuatemalaGuineaGuinea-BissauGuyanaHaitiHeavily indebted poor countries (HIPC)High incomeHondurasHong Kong SAR, ChinaHungaryIBRD onlyIcelandIDA & IBRD totalIDA blendIDA onlyIDA totalIndiaIndonesiaIran, Islamic Rep.IraqIrelandIsraelItalyJamaicaJapanJordanKazakhstanKenyaKiribatiKorea, Dem. People’s Rep.Korea, Rep.KuwaitKyrgyz RepublicLao PDRLate-demographic dividendLatin America & Caribbean Latin America & Caribbean (excluding high income)Latin America & the Caribbean (IDA & IBRD countries)LatviaLeast developed countries: UN classificationLebanonLesothoLiberiaLibyaLithuaniaLow & middle incomeLow incomeLower middle incomeLuxembourgMacao SAR, ChinaMacedonia, FYRMadagascarMalawiMalaysiaMaldivesMaliMaltaMarshall IslandsMauritaniaMauritiusMexicoMiddle East & North AfricaMiddle East & North Africa (excluding high income)Middle East & North Africa (IDA & IBRD countries)Middle incomeMoldovaMonacoMongoliaMontenegroMoroccoMozambiqueMyanmarNamibiaNauruNepalNetherlandsNew ZealandNicaraguaNigerNigeriaNorth AmericaNorwayOECD membersOmanOther small statesPacific island small statesPakistanPanamaPapua New GuineaParaguayPeruPhilippinesPolandPortugalPost-demographic dividendPre-demographic dividendQatarRomaniaRussian FederationRwandaSamoaSao Tome and PrincipeSaudi ArabiaSenegalSerbiaSeychellesSierra LeoneSingaporeSlovak RepublicSloveniaSmall statesSolomon IslandsSomaliaSouth AfricaSouth AsiaSouth Asia (IDA & IBRD)SpainSri LankaSub-Saharan Africa Sub-Saharan Africa (excluding high income)Sub-Saharan Africa (IDA & IBRD countries)SudanSurinameSwazilandSwedenSwitzerlandSyrian Arab RepublicTajikistanTanzaniaThailandTogoTongaTrinidad and TobagoTunisiaTurkeyTurkmenistanUgandaUkraineUnited Arab EmiratesUnited KingdomUnited StatesUpper middle incomeUruguayUzbekistanVanuatuVenezuela, RBVietnamWorldYemen, Rep.ZambiaZimbabwe Timeline:
This timeline shows a graph from 1975 to 2016 of Oman. No data until 1974. Number of actual observations by date: 38.
Source name:
World Development Indicators
Source organization:
International Civil Aviation Organization, Civil Aviation Statistics of the World and ICAO staff estimates.
Categories, topics:
Infrastructure
Last updated:
apr 23, 2017
Indicators value changes by year
Maximum:
412.234
jan 1, 2016
At the date of observation
Value
Absolute change
Change from previous value
jan 1, 1976
4.0
+1.8
81.82%
jan 1, 1977
6.8
+2.8
70.0%
jan 1, 1978
8.2
+1.4
20.59%
jan 1, 1979
9.6
+1.4
17.07%
jan 1, 1980
14.0
+4.4
45.83%
jan 1, 1981
26.2
+12.2
87.14%
jan 1, 1982
21.4
-4.8
-18.32%
jan 1, 1983
21.6
+0.2
0.93%
jan 1, 1984
23.8
+2.2
10.19%
jan 1, 1985
30.7
+6.9
28.99%
jan 1, 1986
32.6
+1.9
6.19%
jan 1, 1987
31.4
-1.2
-3.68%
jan 1, 1988
31.5
+0.1
0.32%
jan 1, 1989
33.9
+2.4
7.62%
jan 1, 1990
40.0
+6.1
17.99%
jan 1, 1991
44.3
+4.3
10.75%
jan 1, 1992
51.2
+6.9
15.58%
jan 1, 1993
69.8
+18.6
36.33%
jan 1, 1994
88.2
+18.4
26.36%
jan 1, 1995
122.2
+34.0
38.55%
jan 1, 1996
132.8
+10.6
8.67%
jan 1, 1997
105.8
-27.0
-20.33%
jan 1, 1998
99.5
-6.3
-5.95%
jan 1, 1999
110.3
+10.8
10.85%
jan 1, 2000
126.4
+16.1
14.6%
jan 1, 2001
152.145
+25.745
20.37%
jan 1, 2002
143.092
-9.053
-5.95%
jan 1, 2003
130.409
-12.683
-8.86%
jan 1, 2004
189.972
+59.563
45.67%
jan 1, 2005
235.186
+45.214
23.8%
jan 1, 2010
39.196
-195.99
-83.33%
jan 1, 2011
106.579
+67.383
171.91%
jan 1, 2012
171.732
+65.153
61.13%
jan 1, 2013
240.695
+68.963
40.16%
jan 1, 2014
251.141
+10.446
4.34%
jan 1, 2015
291.939
+40.798
16.25%
jan 1, 2016
412.234
+120.295
41.21%
Ranking of countries by current statistics by years


Comments: