29
/
en
AIzaSyAYiBZKx7MnpbEhh9jyipgxe19OcubqV5w
April 1, 2024
286830
Zimbabwe
ZWE
true
2
1
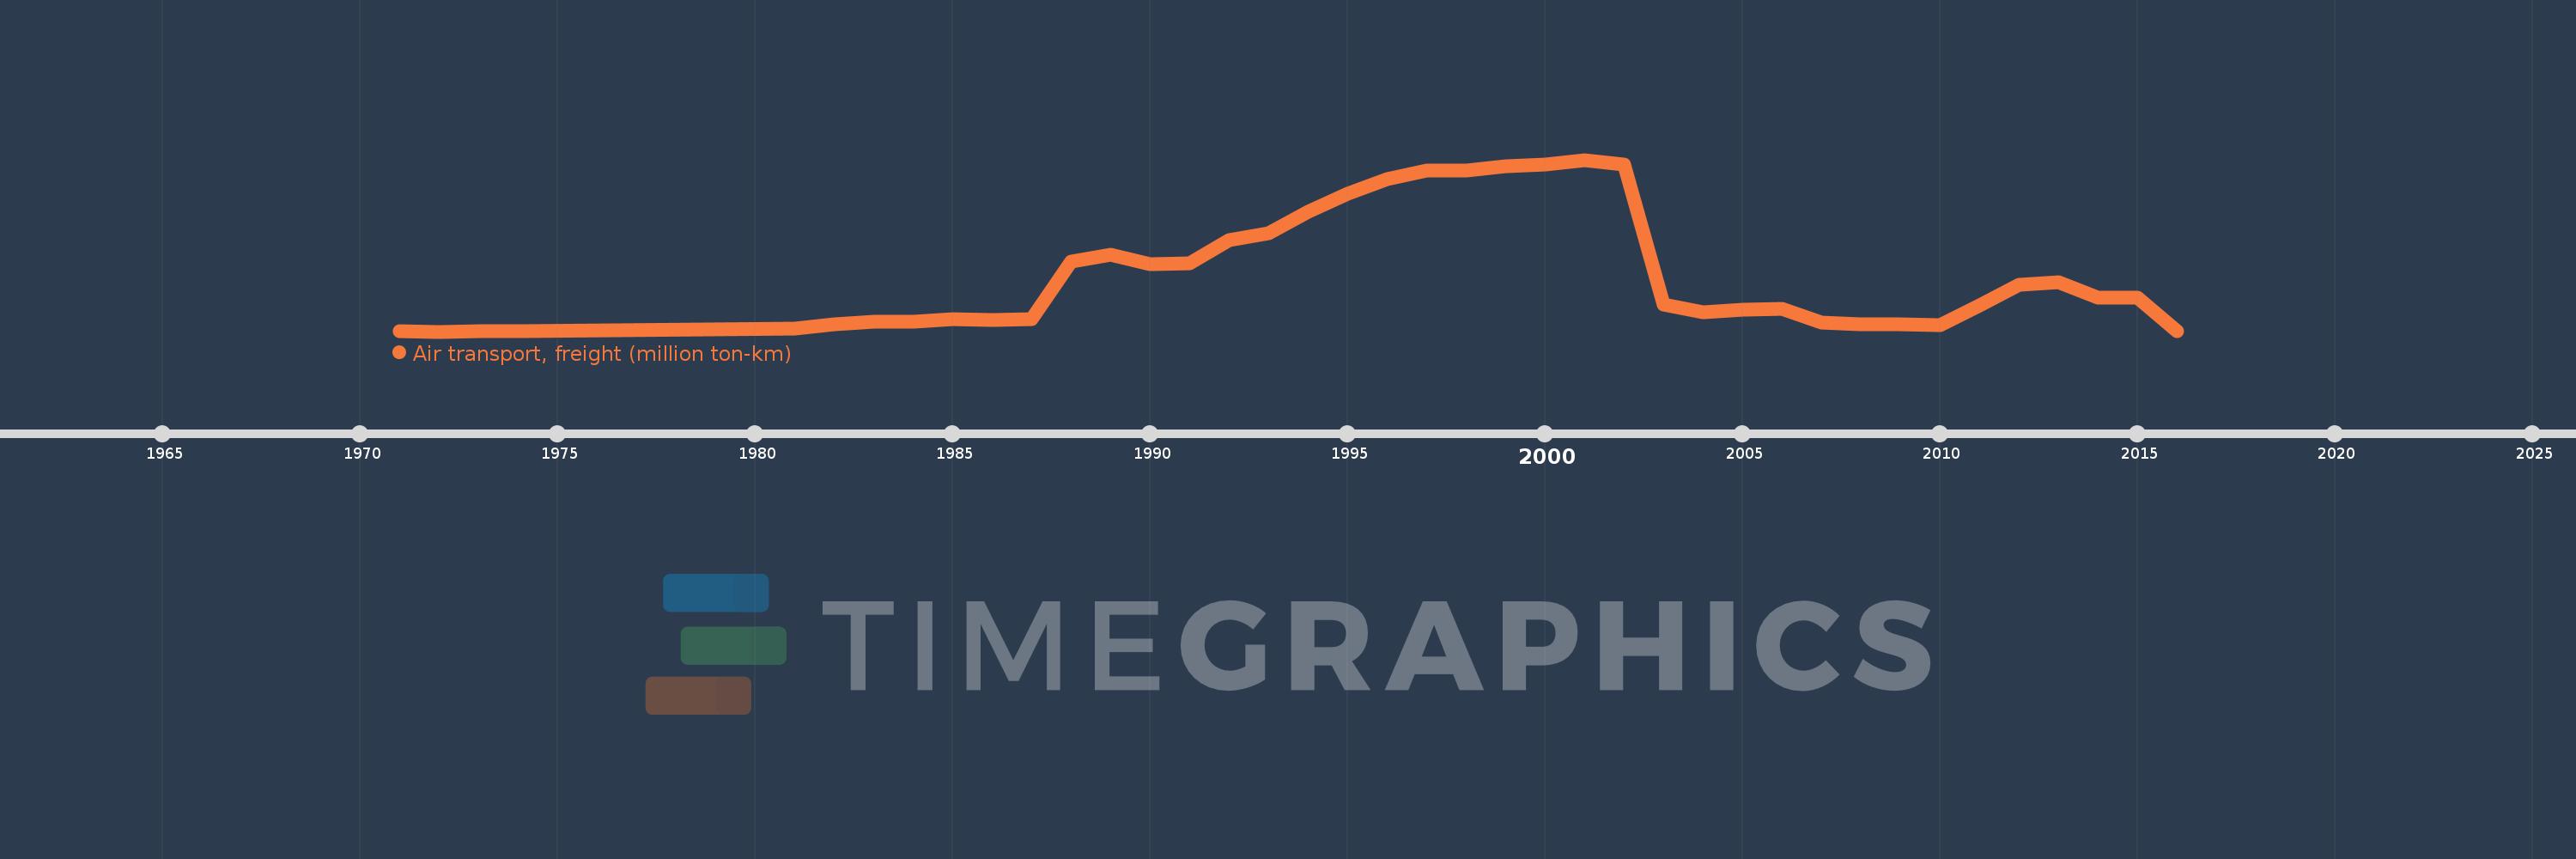
Air transport, freight (million ton-km)
2016,2015,2014,2013,2012,2011,2010,2009,2008,2007,2006,2005,2004,2003,2002,2001,2000,1999,1998,1997,1996,1995,1994,1993,1992,1991,1990,1989,1988,1987,1986,1985,1984,1983,1982,1981,1974,1973,1972,1971
This statistics in other country:
AfghanistanAlbaniaAlgeriaAmerican SamoaAngolaAntigua and BarbudaArab WorldArgentinaArmeniaAustraliaAustriaAzerbaijanBahamas, TheBahrainBangladeshBarbadosBelarusBelgiumBelizeBeninBhutanBoliviaBosnia and HerzegovinaBotswanaBrazilBrunei DarussalamBulgariaBurkina FasoBurundiCabo VerdeCambodiaCameroonCanadaCaribbean small statesCentral African RepublicCentral Europe and the BalticsChadChileChinaColombiaComorosCongo, Dem. Rep.Congo, Rep.Costa RicaCote d'IvoireCroatiaCubaCyprusCzech RepublicDenmarkDjiboutiDominican RepublicEarly-demographic dividendEast Asia & PacificEast Asia & Pacific (excluding high income)East Asia & Pacific (IDA & IBRD countries)EcuadorEgypt, Arab Rep.El SalvadorEquatorial GuineaEritreaEstoniaEthiopiaEuro areaEurope & Central AsiaEurope & Central Asia (excluding high income)Europe & Central Asia (IDA & IBRD countries)European UnionFijiFinlandFragile and conflict affected situationsFranceGabonGambia, TheGeorgiaGermanyGhanaGreeceGuamGuatemalaGuineaGuinea-BissauGuyanaHaitiHeavily indebted poor countries (HIPC)High incomeHondurasHong Kong SAR, ChinaHungaryIBRD onlyIcelandIDA & IBRD totalIDA blendIDA onlyIDA totalIndiaIndonesiaIran, Islamic Rep.IraqIrelandIsraelItalyJamaicaJapanJordanKazakhstanKenyaKiribatiKorea, Dem. People’s Rep.Korea, Rep.KuwaitKyrgyz RepublicLao PDRLate-demographic dividendLatin America & Caribbean Latin America & Caribbean (excluding high income)Latin America & the Caribbean (IDA & IBRD countries)LatviaLeast developed countries: UN classificationLebanonLesothoLiberiaLibyaLithuaniaLow & middle incomeLow incomeLower middle incomeLuxembourgMacao SAR, ChinaMacedonia, FYRMadagascarMalawiMalaysiaMaldivesMaliMaltaMarshall IslandsMauritaniaMauritiusMexicoMiddle East & North AfricaMiddle East & North Africa (excluding high income)Middle East & North Africa (IDA & IBRD countries)Middle incomeMoldovaMonacoMongoliaMontenegroMoroccoMozambiqueMyanmarNamibiaNauruNepalNetherlandsNew ZealandNicaraguaNigerNigeriaNorth AmericaNorwayOECD membersOmanOther small statesPacific island small statesPakistanPanamaPapua New GuineaParaguayPeruPhilippinesPolandPortugalPost-demographic dividendPre-demographic dividendQatarRomaniaRussian FederationRwandaSamoaSao Tome and PrincipeSaudi ArabiaSenegalSerbiaSeychellesSierra LeoneSingaporeSlovak RepublicSloveniaSmall statesSolomon IslandsSomaliaSouth AfricaSouth AsiaSouth Asia (IDA & IBRD)SpainSri LankaSub-Saharan Africa Sub-Saharan Africa (excluding high income)Sub-Saharan Africa (IDA & IBRD countries)SudanSurinameSwazilandSwedenSwitzerlandSyrian Arab RepublicTajikistanTanzaniaThailandTogoTongaTrinidad and TobagoTunisiaTurkeyTurkmenistanUgandaUkraineUnited Arab EmiratesUnited KingdomUnited StatesUpper middle incomeUruguayUzbekistanVanuatuVenezuela, RBVietnamWorldYemen, Rep.ZambiaZimbabwe Timeline:
This timeline shows a graph from 1971 to 2016 of Zimbabwe. No data until 1970. Number of actual observations by date: 40.
Source name:
World Development Indicators
Source organization:
International Civil Aviation Organization, Civil Aviation Statistics of the World and ICAO staff estimates.
Categories, topics:
Infrastructure
Last updated:
apr 23, 2017
Indicators value changes by year
Maximum:
162.987
jan 1, 2001
At the date of observation
Value
Absolute change
Change from previous value
jan 1, 1972
0.4
-0.2
-33.33%
jan 1, 1973
0.5
+0.1
25.0%
jan 1, 1974
0.6
+0.1
20.0%
jan 1, 1981
3.2
+2.6
433.33%
jan 1, 1982
7.6
+4.4
137.5%
jan 1, 1983
9.4
+1.8
23.68%
jan 1, 1984
10.0
+0.6
6.38%
jan 1, 1985
11.9
+1.9
19.0%
jan 1, 1986
11.1
-0.8
-6.72%
jan 1, 1987
12.5
+1.4
12.61%
jan 1, 1988
66.9
+54.4
435.2%
jan 1, 1989
73.4
+6.5
9.72%
jan 1, 1990
64.6
-8.8
-11.99%
jan 1, 1991
64.9
+0.3
0.46%
jan 1, 1992
87.0
+22.1
34.05%
jan 1, 1993
93.5
+6.5
7.47%
jan 1, 1994
113.7
+20.2
21.6%
jan 1, 1995
130.8
+17.1
15.04%
jan 1, 1996
144.4
+13.6
10.4%
jan 1, 1997
152.9
+8.5
5.89%
jan 1, 1998
153.1
+0.2
0.13%
jan 1, 1999
156.9
+3.8
2.48%
jan 1, 2000
158.2
+1.3
0.83%
jan 1, 2001
162.987
+4.787
3.03%
jan 1, 2002
158.174
-4.813
-2.95%
jan 1, 2003
25.813
-132.361
-83.68%
jan 1, 2004
18.494
-7.319
-28.35%
jan 1, 2005
20.823
+2.329
12.59%
jan 1, 2006
22.252
+1.429
6.86%
jan 1, 2007
8.547
-13.705
-61.59%
jan 1, 2008
7.692
-0.855
-10.0%
jan 1, 2009
7.464
-0.228
-2.96%
jan 1, 2010
6.775
-0.689
-9.23%
jan 1, 2011
25.139
+18.364
271.05%
jan 1, 2012
44.685
+19.546
77.75%
jan 1, 2013
47.288
+2.603
5.83%
jan 1, 2014
32.682
-14.606
-30.89%
jan 1, 2015
32.702
+0.02
0.06%
jan 1, 2016
0.963
-31.739
-97.06%
Ranking of countries by current statistics by years


Comments: