29
/
en
AIzaSyAYiBZKx7MnpbEhh9jyipgxe19OcubqV5w
April 1, 2024
234394
Saudi Arabia
SAU
true
2
1
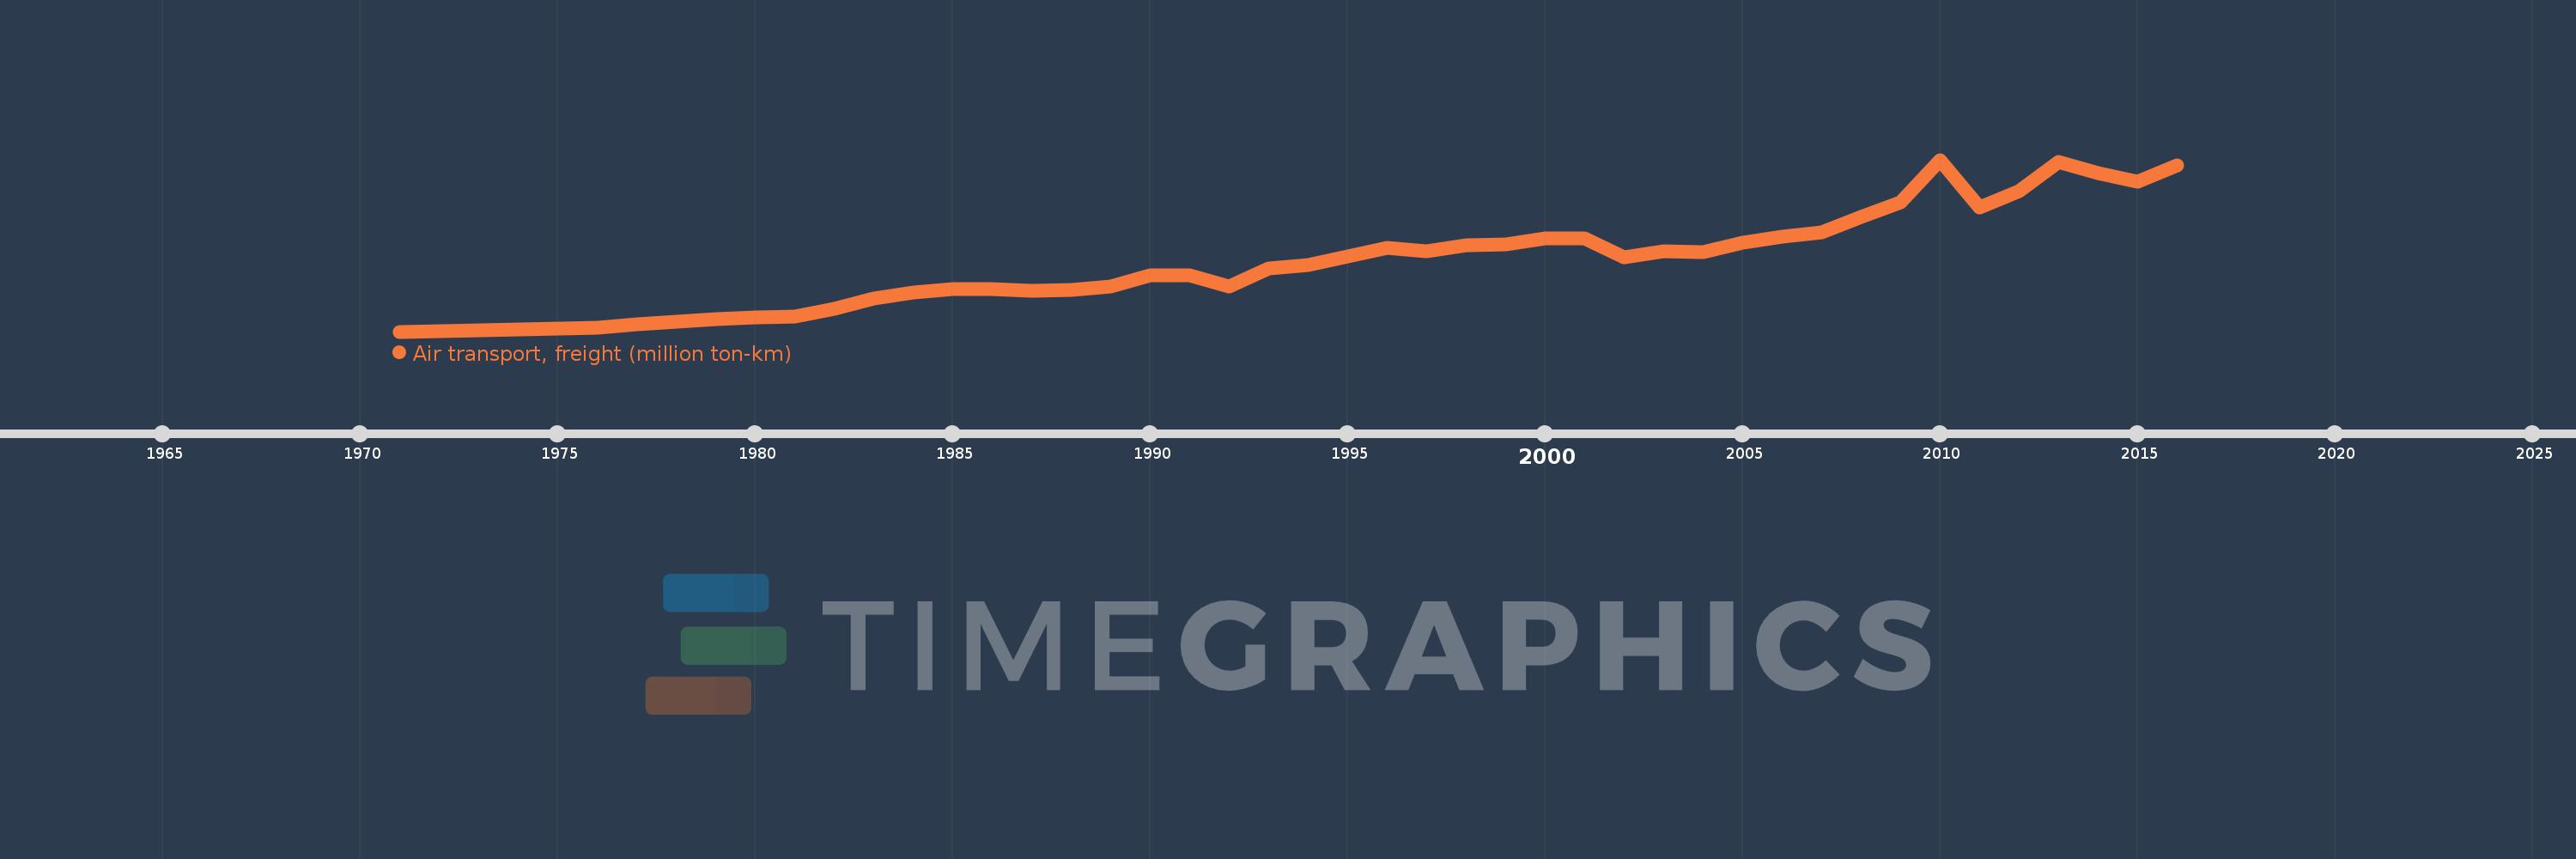
Air transport, freight (million ton-km)
2016,2015,2014,2013,2012,2011,2010,2009,2008,2007,2006,2005,2004,2003,2002,2001,2000,1999,1998,1997,1996,1995,1994,1993,1992,1991,1990,1989,1988,1987,1986,1985,1984,1983,1982,1981,1980,1979,1978,1977,1976,1975,1974,1973,1972,1971
This statistics in other country:
AfghanistanAlbaniaAlgeriaAmerican SamoaAngolaAntigua and BarbudaArab WorldArgentinaArmeniaAustraliaAustriaAzerbaijanBahamas, TheBahrainBangladeshBarbadosBelarusBelgiumBelizeBeninBhutanBoliviaBosnia and HerzegovinaBotswanaBrazilBrunei DarussalamBulgariaBurkina FasoBurundiCabo VerdeCambodiaCameroonCanadaCaribbean small statesCentral African RepublicCentral Europe and the BalticsChadChileChinaColombiaComorosCongo, Dem. Rep.Congo, Rep.Costa RicaCote d'IvoireCroatiaCubaCyprusCzech RepublicDenmarkDjiboutiDominican RepublicEarly-demographic dividendEast Asia & PacificEast Asia & Pacific (excluding high income)East Asia & Pacific (IDA & IBRD countries)EcuadorEgypt, Arab Rep.El SalvadorEquatorial GuineaEritreaEstoniaEthiopiaEuro areaEurope & Central AsiaEurope & Central Asia (excluding high income)Europe & Central Asia (IDA & IBRD countries)European UnionFijiFinlandFragile and conflict affected situationsFranceGabonGambia, TheGeorgiaGermanyGhanaGreeceGuamGuatemalaGuineaGuinea-BissauGuyanaHaitiHeavily indebted poor countries (HIPC)High incomeHondurasHong Kong SAR, ChinaHungaryIBRD onlyIcelandIDA & IBRD totalIDA blendIDA onlyIDA totalIndiaIndonesiaIran, Islamic Rep.IraqIrelandIsraelItalyJamaicaJapanJordanKazakhstanKenyaKiribatiKorea, Dem. People’s Rep.Korea, Rep.KuwaitKyrgyz RepublicLao PDRLate-demographic dividendLatin America & Caribbean Latin America & Caribbean (excluding high income)Latin America & the Caribbean (IDA & IBRD countries)LatviaLeast developed countries: UN classificationLebanonLesothoLiberiaLibyaLithuaniaLow & middle incomeLow incomeLower middle incomeLuxembourgMacao SAR, ChinaMacedonia, FYRMadagascarMalawiMalaysiaMaldivesMaliMaltaMarshall IslandsMauritaniaMauritiusMexicoMiddle East & North AfricaMiddle East & North Africa (excluding high income)Middle East & North Africa (IDA & IBRD countries)Middle incomeMoldovaMonacoMongoliaMontenegroMoroccoMozambiqueMyanmarNamibiaNauruNepalNetherlandsNew ZealandNicaraguaNigerNigeriaNorth AmericaNorwayOECD membersOmanOther small statesPacific island small statesPakistanPanamaPapua New GuineaParaguayPeruPhilippinesPolandPortugalPost-demographic dividendPre-demographic dividendQatarRomaniaRussian FederationRwandaSamoaSao Tome and PrincipeSaudi ArabiaSenegalSerbiaSeychellesSierra LeoneSingaporeSlovak RepublicSloveniaSmall statesSolomon IslandsSomaliaSouth AfricaSouth AsiaSouth Asia (IDA & IBRD)SpainSri LankaSub-Saharan Africa Sub-Saharan Africa (excluding high income)Sub-Saharan Africa (IDA & IBRD countries)SudanSurinameSwazilandSwedenSwitzerlandSyrian Arab RepublicTajikistanTanzaniaThailandTogoTongaTrinidad and TobagoTunisiaTurkeyTurkmenistanUgandaUkraineUnited Arab EmiratesUnited KingdomUnited StatesUpper middle incomeUruguayUzbekistanVanuatuVenezuela, RBVietnamWorldYemen, Rep.ZambiaZimbabwe Timeline:
This timeline shows a graph from 1971 to 2016 of Saudi Arabia. No data until 1970. Number of actual observations by date: 46.
Source name:
World Development Indicators
Source organization:
International Civil Aviation Organization, Civil Aviation Statistics of the World and ICAO staff estimates.
Categories, topics:
Infrastructure
Last updated:
apr 23, 2017
Indicators value changes by year
Maximum:
1.838K
jan 1, 2010
At the date of observation
Value
Absolute change
Change from previous value
jan 1, 1972
11.6
+7.1
157.78%
jan 1, 1973
15.1
+3.5
30.17%
jan 1, 1974
26.5
+11.4
75.5%
jan 1, 1975
35.8
+9.3
35.09%
jan 1, 1976
50.1
+14.3
39.94%
jan 1, 1977
82.6
+32.5
64.87%
jan 1, 1978
105.8
+23.2
28.09%
jan 1, 1979
136.5
+30.7
29.02%
jan 1, 1980
155.3
+18.8
13.77%
jan 1, 1981
165.5
+10.2
6.57%
jan 1, 1982
243.1
+77.6
46.89%
jan 1, 1983
353.0
+109.9
45.21%
jan 1, 1984
424.5
+71.5
20.25%
jan 1, 1985
458.8
+34.3
8.08%
jan 1, 1986
455.1
-3.7
-0.81%
jan 1, 1987
437.2
-17.9
-3.93%
jan 1, 1988
453.2
+16.0
3.66%
jan 1, 1989
490.0
+36.8
8.12%
jan 1, 1990
604.7
+114.7
23.41%
jan 1, 1991
609.6
+4.9
0.81%
jan 1, 1992
486.6
-123.0
-20.18%
jan 1, 1993
679.2
+192.6
39.58%
jan 1, 1994
718.3
+39.1
5.76%
jan 1, 1995
809.5
+91.2
12.7%
jan 1, 1996
894.9
+85.4
10.55%
jan 1, 1997
862.8
-32.1
-3.59%
jan 1, 1998
926.4
+63.6
7.37%
jan 1, 1999
934.0
+7.6
0.82%
jan 1, 2000
1000.0
+66.0
7.07%
jan 1, 2001
999.56
-0.44
-0.04%
jan 1, 2002
799.565
-199.995
-20.01%
jan 1, 2003
862.29
+62.725
7.84%
jan 1, 2004
852.449
-9.841
-1.14%
jan 1, 2005
956.687
+104.238
12.23%
jan 1, 2006
1.021K
+64.766
6.77%
jan 1, 2007
1.066K
+44.828
4.39%
jan 1, 2008
1.23K
+163.423
15.33%
jan 1, 2009
1.383K
+152.843
12.43%
jan 1, 2010
1.838K
+455.615
32.95%
jan 1, 2011
1.325K
-513.301
-27.92%
jan 1, 2012
1.501K
+176.414
13.32%
jan 1, 2013
1.815K
+313.741
20.9%
jan 1, 2014
1.694K
-120.644
-6.65%
jan 1, 2015
1.6K
-94.45
-5.57%
jan 1, 2016
1.783K
+183.164
11.45%
Ranking of countries by current statistics by years


Comments: