29
/
en
AIzaSyAYiBZKx7MnpbEhh9jyipgxe19OcubqV5w
April 1, 2024
216022
Pakistan
PAK
true
2
1
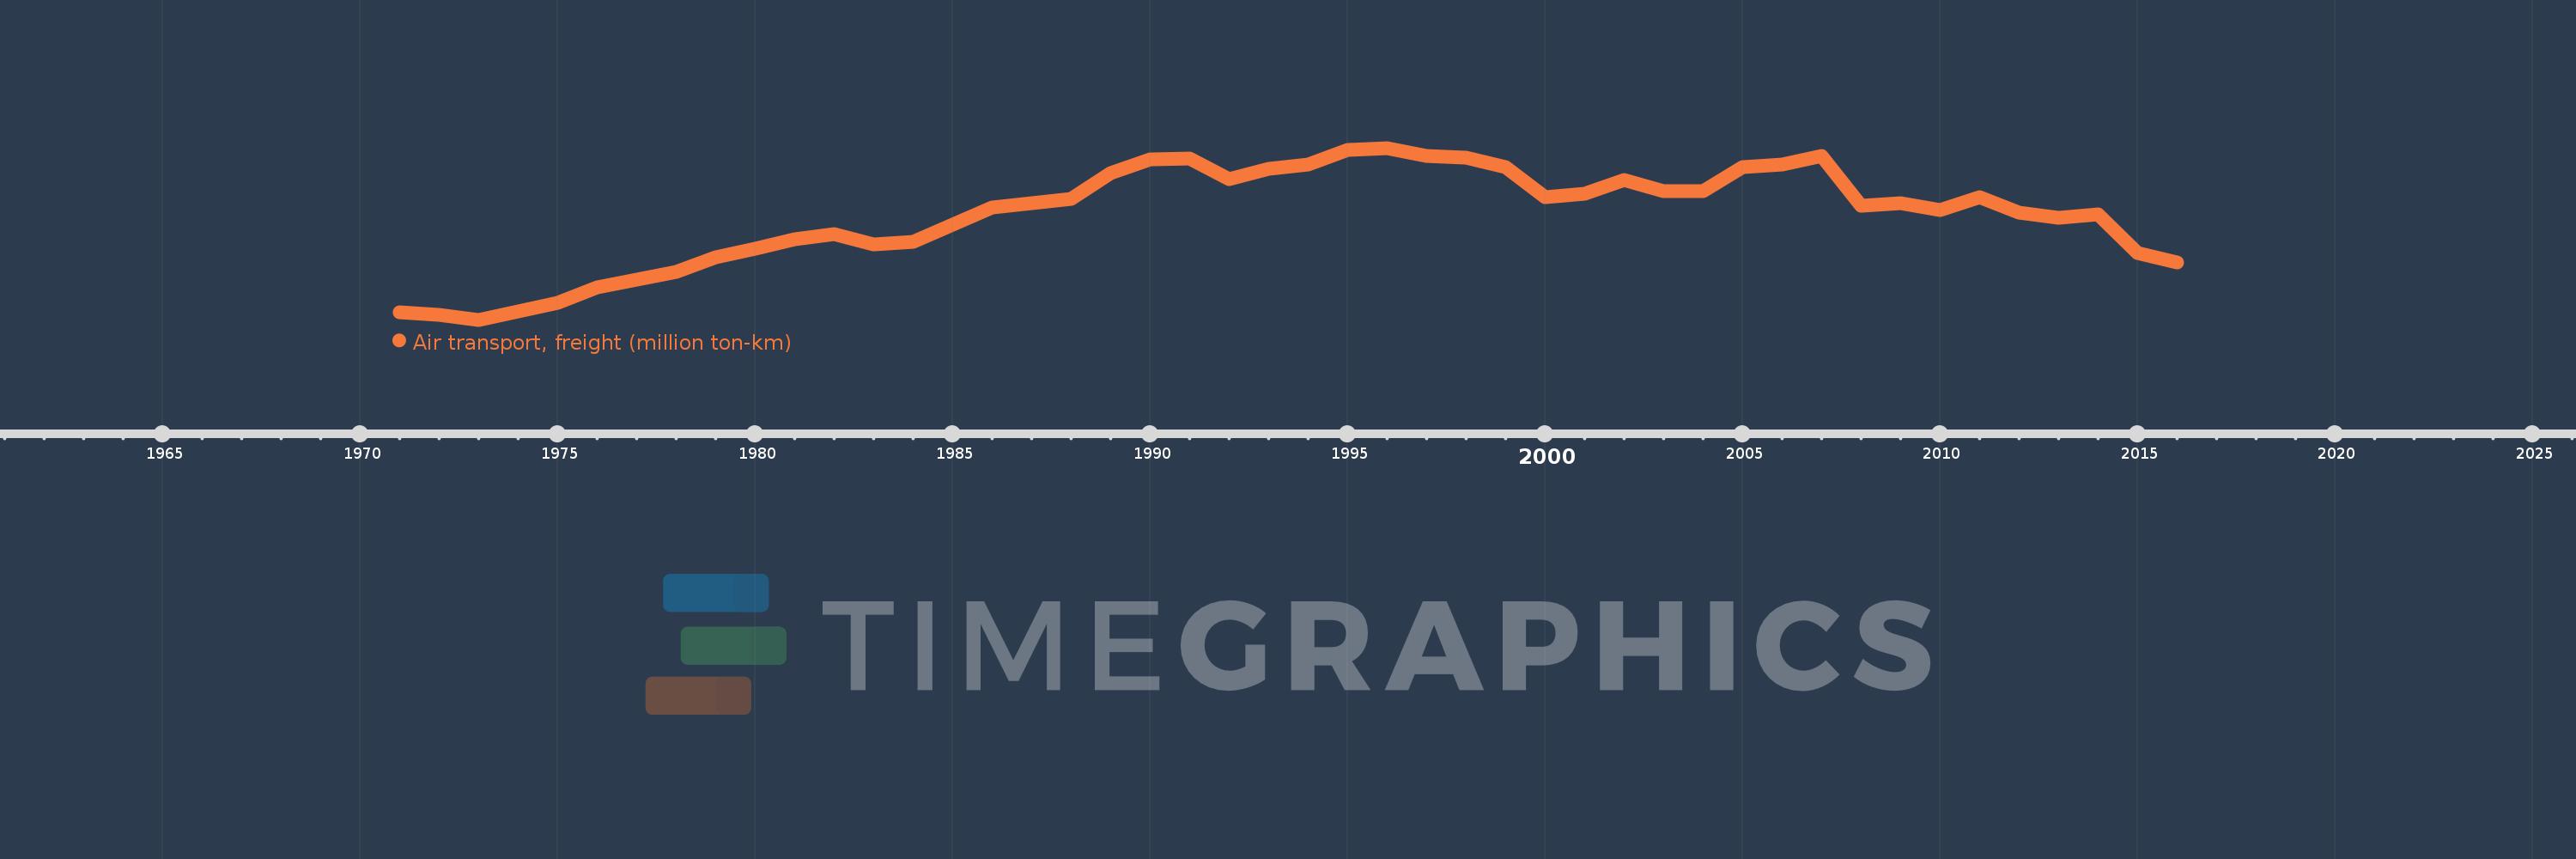
Air transport, freight (million ton-km)
2016,2015,2014,2013,2012,2011,2010,2009,2008,2007,2006,2005,2004,2003,2002,2001,2000,1999,1998,1997,1996,1995,1994,1993,1992,1991,1990,1989,1988,1987,1986,1985,1984,1983,1982,1981,1980,1979,1978,1977,1976,1975,1974,1973,1972,1971
This statistics in other country:
AfghanistanAlbaniaAlgeriaAmerican SamoaAngolaAntigua and BarbudaArab WorldArgentinaArmeniaAustraliaAustriaAzerbaijanBahamas, TheBahrainBangladeshBarbadosBelarusBelgiumBelizeBeninBhutanBoliviaBosnia and HerzegovinaBotswanaBrazilBrunei DarussalamBulgariaBurkina FasoBurundiCabo VerdeCambodiaCameroonCanadaCaribbean small statesCentral African RepublicCentral Europe and the BalticsChadChileChinaColombiaComorosCongo, Dem. Rep.Congo, Rep.Costa RicaCote d'IvoireCroatiaCubaCyprusCzech RepublicDenmarkDjiboutiDominican RepublicEarly-demographic dividendEast Asia & PacificEast Asia & Pacific (excluding high income)East Asia & Pacific (IDA & IBRD countries)EcuadorEgypt, Arab Rep.El SalvadorEquatorial GuineaEritreaEstoniaEthiopiaEuro areaEurope & Central AsiaEurope & Central Asia (excluding high income)Europe & Central Asia (IDA & IBRD countries)European UnionFijiFinlandFragile and conflict affected situationsFranceGabonGambia, TheGeorgiaGermanyGhanaGreeceGuamGuatemalaGuineaGuinea-BissauGuyanaHaitiHeavily indebted poor countries (HIPC)High incomeHondurasHong Kong SAR, ChinaHungaryIBRD onlyIcelandIDA & IBRD totalIDA blendIDA onlyIDA totalIndiaIndonesiaIran, Islamic Rep.IraqIrelandIsraelItalyJamaicaJapanJordanKazakhstanKenyaKiribatiKorea, Dem. People’s Rep.Korea, Rep.KuwaitKyrgyz RepublicLao PDRLate-demographic dividendLatin America & Caribbean Latin America & Caribbean (excluding high income)Latin America & the Caribbean (IDA & IBRD countries)LatviaLeast developed countries: UN classificationLebanonLesothoLiberiaLibyaLithuaniaLow & middle incomeLow incomeLower middle incomeLuxembourgMacao SAR, ChinaMacedonia, FYRMadagascarMalawiMalaysiaMaldivesMaliMaltaMarshall IslandsMauritaniaMauritiusMexicoMiddle East & North AfricaMiddle East & North Africa (excluding high income)Middle East & North Africa (IDA & IBRD countries)Middle incomeMoldovaMonacoMongoliaMontenegroMoroccoMozambiqueMyanmarNamibiaNauruNepalNetherlandsNew ZealandNicaraguaNigerNigeriaNorth AmericaNorwayOECD membersOmanOther small statesPacific island small statesPakistanPanamaPapua New GuineaParaguayPeruPhilippinesPolandPortugalPost-demographic dividendPre-demographic dividendQatarRomaniaRussian FederationRwandaSamoaSao Tome and PrincipeSaudi ArabiaSenegalSerbiaSeychellesSierra LeoneSingaporeSlovak RepublicSloveniaSmall statesSolomon IslandsSomaliaSouth AfricaSouth AsiaSouth Asia (IDA & IBRD)SpainSri LankaSub-Saharan Africa Sub-Saharan Africa (excluding high income)Sub-Saharan Africa (IDA & IBRD countries)SudanSurinameSwazilandSwedenSwitzerlandSyrian Arab RepublicTajikistanTanzaniaThailandTogoTongaTrinidad and TobagoTunisiaTurkeyTurkmenistanUgandaUkraineUnited Arab EmiratesUnited KingdomUnited StatesUpper middle incomeUruguayUzbekistanVanuatuVenezuela, RBVietnamWorldYemen, Rep.ZambiaZimbabwe Timeline:
This timeline shows a graph from 1971 to 2016 of Pakistan. No data until 1970. Number of actual observations by date: 46.
Source name:
World Development Indicators
Source organization:
International Civil Aviation Organization, Civil Aviation Statistics of the World and ICAO staff estimates.
Categories, topics:
Infrastructure
Last updated:
apr 23, 2017
Indicators value changes by year
At the date of observation
Value
Absolute change
Change from previous value
jan 1, 1971
69.6
+69.6
0.0%
jan 1, 1972
63.4
-6.2
-8.91%
jan 1, 1973
52.0
-11.4
-17.98%
jan 1, 1974
70.6
+18.6
35.77%
jan 1, 1975
90.4
+19.8
28.05%
jan 1, 1976
125.3
+34.9
38.61%
jan 1, 1977
144.1
+18.8
15.0%
jan 1, 1978
161.6
+17.5
12.14%
jan 1, 1979
194.8
+33.2
20.54%
jan 1, 1980
214.7
+19.9
10.22%
jan 1, 1981
235.4
+20.7
9.64%
jan 1, 1982
248.5
+13.1
5.56%
jan 1, 1983
224.1
-24.4
-9.82%
jan 1, 1984
230.1
+6.0
2.68%
jan 1, 1985
270.6
+40.5
17.6%
jan 1, 1986
309.8
+39.2
14.49%
jan 1, 1987
319.5
+9.7
3.13%
jan 1, 1988
327.9
+8.4
2.63%
jan 1, 1989
388.8
+60.9
18.57%
jan 1, 1990
418.7
+29.9
7.69%
jan 1, 1991
420.5
+1.8
0.43%
jan 1, 1992
373.3
-47.2
-11.22%
jan 1, 1993
398.6
+25.3
6.78%
jan 1, 1994
408.4
+9.8
2.46%
jan 1, 1995
441.5
+33.1
8.1%
jan 1, 1996
445.5
+4.0
0.91%
jan 1, 1997
427.2
-18.3
-4.11%
jan 1, 1998
422.7
-4.5
-1.05%
jan 1, 1999
402.4
-20.3
-4.8%
jan 1, 2000
331.8
-70.6
-17.54%
jan 1, 2001
340.309
+8.509
2.56%
jan 1, 2002
371.228
+30.919
9.09%
jan 1, 2003
346.88
-24.348
-6.56%
jan 1, 2004
346.607
-0.273
-0.08%
jan 1, 2005
402.035
+55.428
15.99%
jan 1, 2006
407.926
+5.891
1.47%
jan 1, 2007
426.991
+19.065
4.67%
jan 1, 2008
313.872
-113.119
-26.49%
jan 1, 2009
319.796
+5.924
1.89%
jan 1, 2010
303.905
-15.891
-4.97%
jan 1, 2011
332.957
+29.052
9.56%
jan 1, 2012
297.684
-35.274
-10.59%
jan 1, 2013
286.076
-11.608
-3.9%
jan 1, 2014
292.761
+6.685
2.34%
jan 1, 2015
204.623
-88.138
-30.11%
jan 1, 2016
183.177
-21.446
-10.48%
Ranking of countries by current statistics by years


Comments: