29
/
en
AIzaSyAYiBZKx7MnpbEhh9jyipgxe19OcubqV5w
April 1, 2024
164467
Jordan
JOR
true
2
1
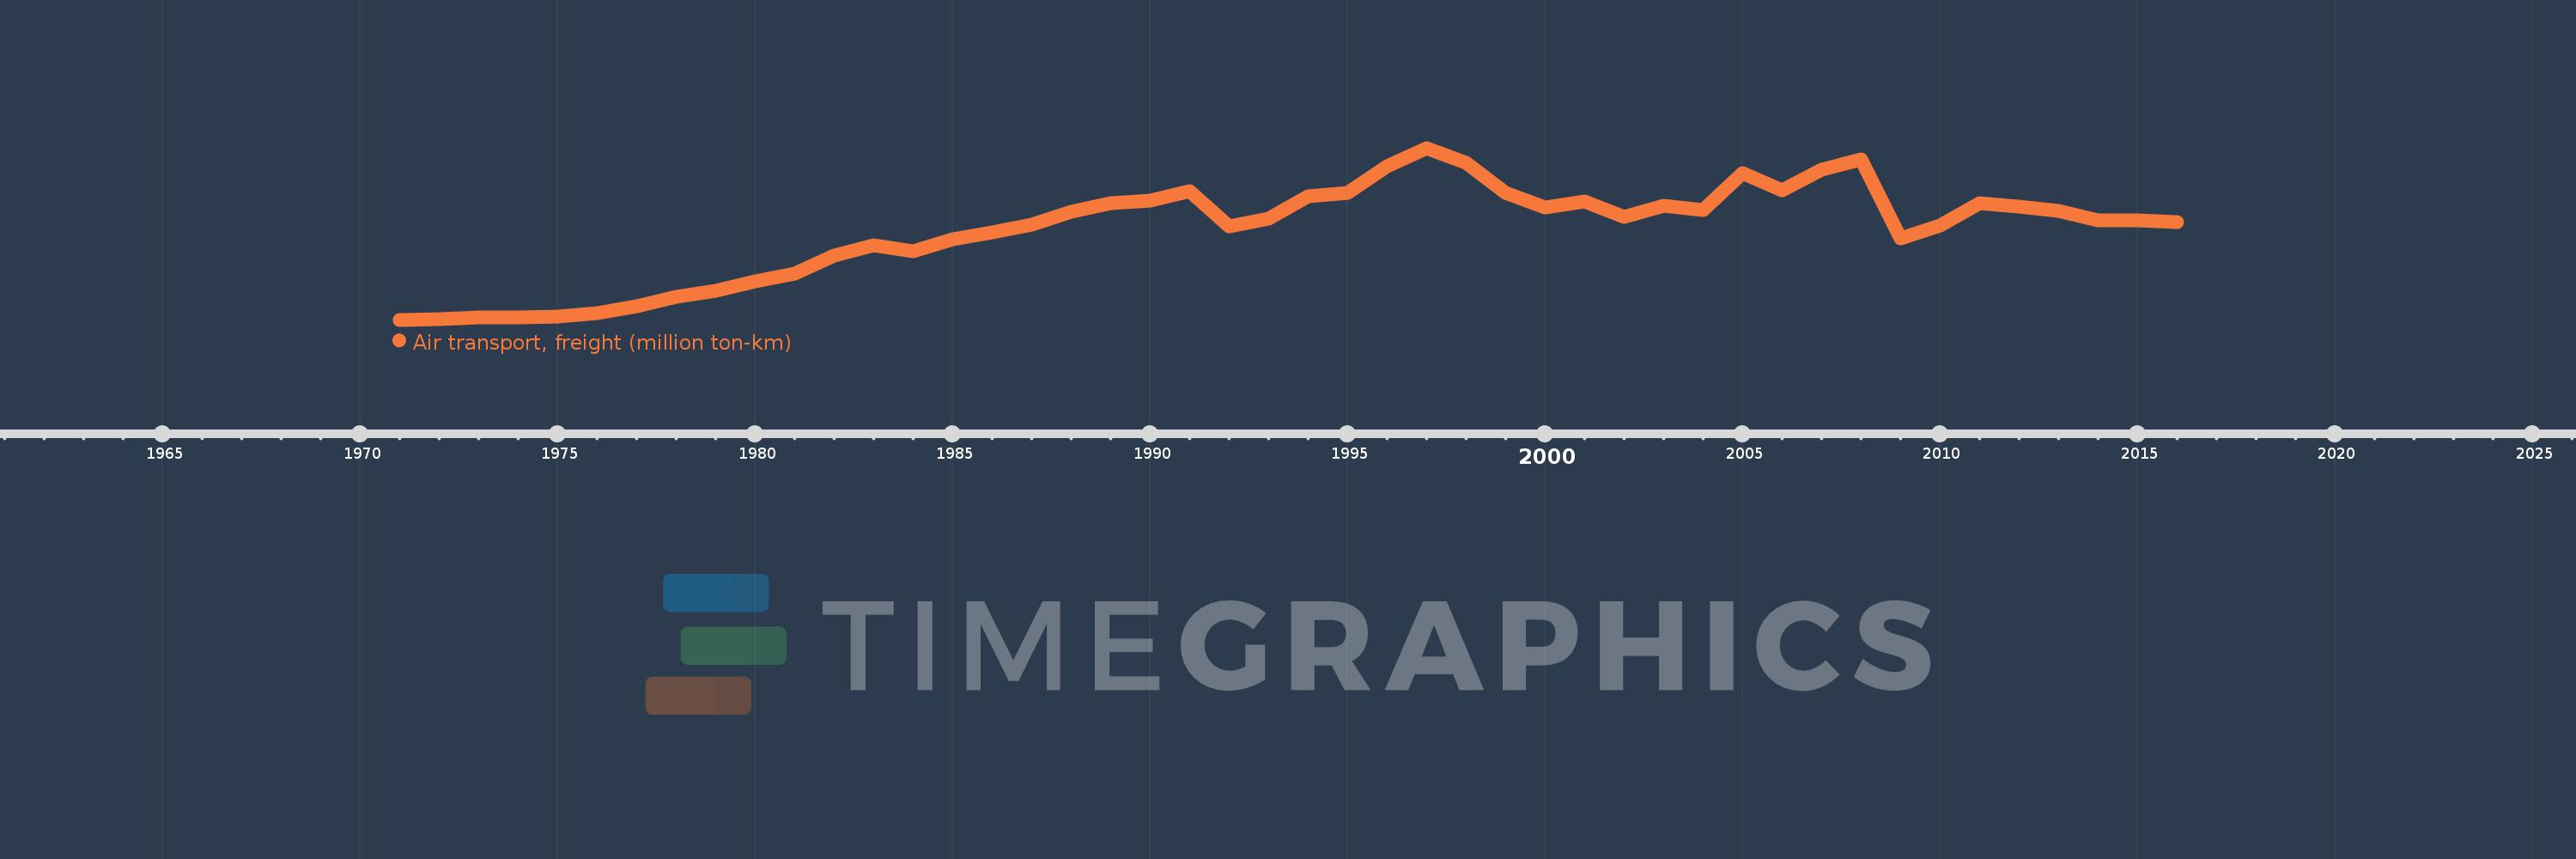
Air transport, freight (million ton-km)
2016,2015,2014,2013,2012,2011,2010,2009,2008,2007,2006,2005,2004,2003,2002,2001,2000,1999,1998,1997,1996,1995,1994,1993,1992,1991,1990,1989,1988,1987,1986,1985,1984,1983,1982,1981,1980,1979,1978,1977,1976,1975,1974,1973,1972,1971
This statistics in other country:
AfghanistanAlbaniaAlgeriaAmerican SamoaAngolaAntigua and BarbudaArab WorldArgentinaArmeniaAustraliaAustriaAzerbaijanBahamas, TheBahrainBangladeshBarbadosBelarusBelgiumBelizeBeninBhutanBoliviaBosnia and HerzegovinaBotswanaBrazilBrunei DarussalamBulgariaBurkina FasoBurundiCabo VerdeCambodiaCameroonCanadaCaribbean small statesCentral African RepublicCentral Europe and the BalticsChadChileChinaColombiaComorosCongo, Dem. Rep.Congo, Rep.Costa RicaCote d'IvoireCroatiaCubaCyprusCzech RepublicDenmarkDjiboutiDominican RepublicEarly-demographic dividendEast Asia & PacificEast Asia & Pacific (excluding high income)East Asia & Pacific (IDA & IBRD countries)EcuadorEgypt, Arab Rep.El SalvadorEquatorial GuineaEritreaEstoniaEthiopiaEuro areaEurope & Central AsiaEurope & Central Asia (excluding high income)Europe & Central Asia (IDA & IBRD countries)European UnionFijiFinlandFragile and conflict affected situationsFranceGabonGambia, TheGeorgiaGermanyGhanaGreeceGuamGuatemalaGuineaGuinea-BissauGuyanaHaitiHeavily indebted poor countries (HIPC)High incomeHondurasHong Kong SAR, ChinaHungaryIBRD onlyIcelandIDA & IBRD totalIDA blendIDA onlyIDA totalIndiaIndonesiaIran, Islamic Rep.IraqIrelandIsraelItalyJamaicaJapanJordanKazakhstanKenyaKiribatiKorea, Dem. People’s Rep.Korea, Rep.KuwaitKyrgyz RepublicLao PDRLate-demographic dividendLatin America & Caribbean Latin America & Caribbean (excluding high income)Latin America & the Caribbean (IDA & IBRD countries)LatviaLeast developed countries: UN classificationLebanonLesothoLiberiaLibyaLithuaniaLow & middle incomeLow incomeLower middle incomeLuxembourgMacao SAR, ChinaMacedonia, FYRMadagascarMalawiMalaysiaMaldivesMaliMaltaMarshall IslandsMauritaniaMauritiusMexicoMiddle East & North AfricaMiddle East & North Africa (excluding high income)Middle East & North Africa (IDA & IBRD countries)Middle incomeMoldovaMonacoMongoliaMontenegroMoroccoMozambiqueMyanmarNamibiaNauruNepalNetherlandsNew ZealandNicaraguaNigerNigeriaNorth AmericaNorwayOECD membersOmanOther small statesPacific island small statesPakistanPanamaPapua New GuineaParaguayPeruPhilippinesPolandPortugalPost-demographic dividendPre-demographic dividendQatarRomaniaRussian FederationRwandaSamoaSao Tome and PrincipeSaudi ArabiaSenegalSerbiaSeychellesSierra LeoneSingaporeSlovak RepublicSloveniaSmall statesSolomon IslandsSomaliaSouth AfricaSouth AsiaSouth Asia (IDA & IBRD)SpainSri LankaSub-Saharan Africa Sub-Saharan Africa (excluding high income)Sub-Saharan Africa (IDA & IBRD countries)SudanSurinameSwazilandSwedenSwitzerlandSyrian Arab RepublicTajikistanTanzaniaThailandTogoTongaTrinidad and TobagoTunisiaTurkeyTurkmenistanUgandaUkraineUnited Arab EmiratesUnited KingdomUnited StatesUpper middle incomeUruguayUzbekistanVanuatuVenezuela, RBVietnamWorldYemen, Rep.ZambiaZimbabwe Timeline:
This timeline shows a graph from 1971 to 2016 of Jordan. No data until 1970. Number of actual observations by date: 46.
Source name:
World Development Indicators
Source organization:
International Civil Aviation Organization, Civil Aviation Statistics of the World and ICAO staff estimates.
Categories, topics:
Infrastructure
Last updated:
apr 23, 2017
Indicators value changes by year
At the date of observation
Value
Absolute change
Change from previous value
jan 1, 1972
2.6
+1.4
116.67%
jan 1, 1973
4.7
+2.1
80.77%
jan 1, 1974
5.4
+0.7
14.89%
jan 1, 1975
7.2
+1.8
33.33%
jan 1, 1976
13.2
+6.0
83.33%
jan 1, 1977
24.5
+11.3
85.61%
jan 1, 1978
40.1
+15.6
63.67%
jan 1, 1979
51.0
+10.9
27.18%
jan 1, 1980
67.0
+16.0
31.37%
jan 1, 1981
80.2
+13.2
19.7%
jan 1, 1982
111.9
+31.7
39.53%
jan 1, 1983
129.5
+17.6
15.73%
jan 1, 1984
119.3
-10.2
-7.88%
jan 1, 1985
139.9
+20.6
17.27%
jan 1, 1986
151.8
+11.9
8.51%
jan 1, 1987
164.7
+12.9
8.5%
jan 1, 1988
186.3
+21.6
13.11%
jan 1, 1989
201.5
+15.2
8.16%
jan 1, 1990
206.0
+4.5
2.23%
jan 1, 1991
222.8
+16.8
8.16%
jan 1, 1992
161.5
-61.3
-27.51%
jan 1, 1993
175.5
+14.0
8.67%
jan 1, 1994
213.5
+38.0
21.65%
jan 1, 1995
219.6
+6.1
2.86%
jan 1, 1996
265.2
+45.6
20.77%
jan 1, 1997
296.6
+31.4
11.84%
jan 1, 1998
271.0
-25.6
-8.63%
jan 1, 1999
219.2
-51.8
-19.11%
jan 1, 2000
193.6
-25.6
-11.68%
jan 1, 2001
204.022
+10.422
5.38%
jan 1, 2002
177.79
-26.232
-12.86%
jan 1, 2003
197.317
+19.527
10.98%
jan 1, 2004
190.326
-6.991
-3.54%
jan 1, 2005
253.845
+63.519
33.37%
jan 1, 2006
223.582
-30.263
-11.92%
jan 1, 2007
258.557
+34.975
15.64%
jan 1, 2008
276.656
+18.099
7.0%
jan 1, 2009
140.846
-135.81
-49.09%
jan 1, 2010
163.192
+22.346
15.87%
jan 1, 2011
201.985
+38.793
23.77%
jan 1, 2012
196.185
-5.8
-2.87%
jan 1, 2013
188.065
-8.12
-4.14%
jan 1, 2014
172.126
-15.939
-8.48%
jan 1, 2015
171.97
-0.156
-0.09%
jan 1, 2016
169.105
-2.865
-1.67%
Ranking of countries by current statistics by years


Comments: