29
/
en
AIzaSyAYiBZKx7MnpbEhh9jyipgxe19OcubqV5w
April 1, 2024
176080
Lebanon
LBN
true
2
1
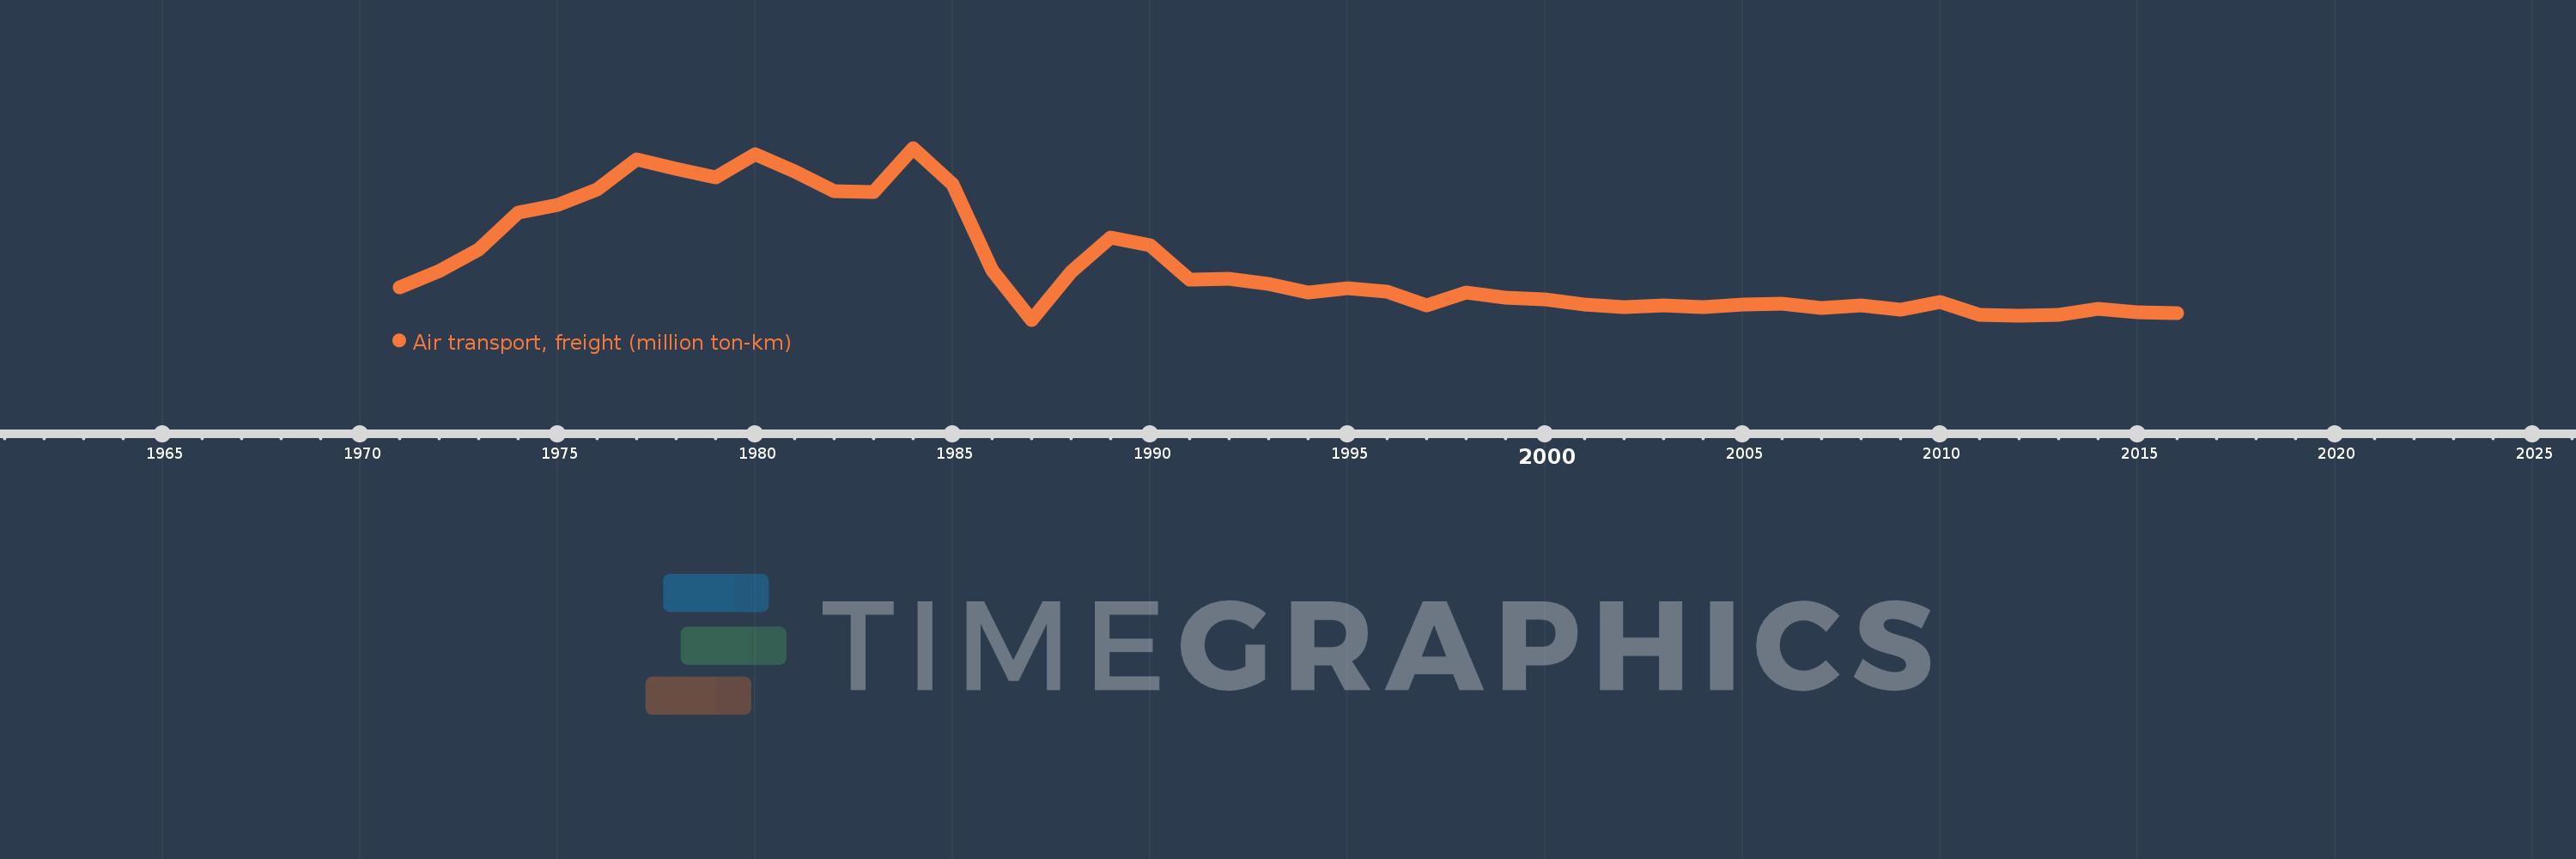
Air transport, freight (million ton-km)
2016,2015,2014,2013,2012,2011,2010,2009,2008,2007,2006,2005,2004,2003,2002,2001,2000,1999,1998,1997,1996,1995,1994,1993,1992,1991,1990,1989,1988,1987,1986,1985,1984,1983,1982,1981,1980,1979,1978,1977,1976,1975,1974,1973,1972,1971
This statistics in other country:
AfghanistanAlbaniaAlgeriaAmerican SamoaAngolaAntigua and BarbudaArab WorldArgentinaArmeniaAustraliaAustriaAzerbaijanBahamas, TheBahrainBangladeshBarbadosBelarusBelgiumBelizeBeninBhutanBoliviaBosnia and HerzegovinaBotswanaBrazilBrunei DarussalamBulgariaBurkina FasoBurundiCabo VerdeCambodiaCameroonCanadaCaribbean small statesCentral African RepublicCentral Europe and the BalticsChadChileChinaColombiaComorosCongo, Dem. Rep.Congo, Rep.Costa RicaCote d'IvoireCroatiaCubaCyprusCzech RepublicDenmarkDjiboutiDominican RepublicEarly-demographic dividendEast Asia & PacificEast Asia & Pacific (excluding high income)East Asia & Pacific (IDA & IBRD countries)EcuadorEgypt, Arab Rep.El SalvadorEquatorial GuineaEritreaEstoniaEthiopiaEuro areaEurope & Central AsiaEurope & Central Asia (excluding high income)Europe & Central Asia (IDA & IBRD countries)European UnionFijiFinlandFragile and conflict affected situationsFranceGabonGambia, TheGeorgiaGermanyGhanaGreeceGuamGuatemalaGuineaGuinea-BissauGuyanaHaitiHeavily indebted poor countries (HIPC)High incomeHondurasHong Kong SAR, ChinaHungaryIBRD onlyIcelandIDA & IBRD totalIDA blendIDA onlyIDA totalIndiaIndonesiaIran, Islamic Rep.IraqIrelandIsraelItalyJamaicaJapanJordanKazakhstanKenyaKiribatiKorea, Dem. People’s Rep.Korea, Rep.KuwaitKyrgyz RepublicLao PDRLate-demographic dividendLatin America & Caribbean Latin America & Caribbean (excluding high income)Latin America & the Caribbean (IDA & IBRD countries)LatviaLeast developed countries: UN classificationLebanonLesothoLiberiaLibyaLithuaniaLow & middle incomeLow incomeLower middle incomeLuxembourgMacao SAR, ChinaMacedonia, FYRMadagascarMalawiMalaysiaMaldivesMaliMaltaMarshall IslandsMauritaniaMauritiusMexicoMiddle East & North AfricaMiddle East & North Africa (excluding high income)Middle East & North Africa (IDA & IBRD countries)Middle incomeMoldovaMonacoMongoliaMontenegroMoroccoMozambiqueMyanmarNamibiaNauruNepalNetherlandsNew ZealandNicaraguaNigerNigeriaNorth AmericaNorwayOECD membersOmanOther small statesPacific island small statesPakistanPanamaPapua New GuineaParaguayPeruPhilippinesPolandPortugalPost-demographic dividendPre-demographic dividendQatarRomaniaRussian FederationRwandaSamoaSao Tome and PrincipeSaudi ArabiaSenegalSerbiaSeychellesSierra LeoneSingaporeSlovak RepublicSloveniaSmall statesSolomon IslandsSomaliaSouth AfricaSouth AsiaSouth Asia (IDA & IBRD)SpainSri LankaSub-Saharan Africa Sub-Saharan Africa (excluding high income)Sub-Saharan Africa (IDA & IBRD countries)SudanSurinameSwazilandSwedenSwitzerlandSyrian Arab RepublicTajikistanTanzaniaThailandTogoTongaTrinidad and TobagoTunisiaTurkeyTurkmenistanUgandaUkraineUnited Arab EmiratesUnited KingdomUnited StatesUpper middle incomeUruguayUzbekistanVanuatuVenezuela, RBVietnamWorldYemen, Rep.ZambiaZimbabwe Timeline:
This timeline shows a graph from 1971 to 2016 of Lebanon. No data until 1970. Number of actual observations by date: 46.
Source name:
World Development Indicators
Source organization:
International Civil Aviation Organization, Civil Aviation Statistics of the World and ICAO staff estimates.
Categories, topics:
Infrastructure
Last updated:
apr 23, 2017
Indicators value changes by year
At the date of observation
Value
Absolute change
Change from previous value
jan 1, 1971
143.1
+143.1
0.0%
jan 1, 1972
196.8
+53.7
37.53%
jan 1, 1973
269.1
+72.3
36.74%
jan 1, 1974
391.7
+122.6
45.56%
jan 1, 1975
418.8
+27.1
6.92%
jan 1, 1976
470.9
+52.1
12.44%
jan 1, 1977
573.0
+102.1
21.68%
jan 1, 1978
540.2
-32.8
-5.72%
jan 1, 1979
510.4
-29.8
-5.52%
jan 1, 1980
589.9
+79.5
15.58%
jan 1, 1981
530.6
-59.3
-10.05%
jan 1, 1982
465.9
-64.7
-12.19%
jan 1, 1983
461.9
-4.0
-0.86%
jan 1, 1984
610.1
+148.2
32.08%
jan 1, 1985
487.7
-122.4
-20.06%
jan 1, 1986
199.8
-287.9
-59.03%
jan 1, 1987
33.1
-166.7
-83.43%
jan 1, 1988
194.8
+161.7
488.52%
jan 1, 1989
309.2
+114.4
58.73%
jan 1, 1990
283.5
-25.7
-8.31%
jan 1, 1991
167.1
-116.4
-41.06%
jan 1, 1992
169.6
+2.5
1.5%
jan 1, 1993
152.7
-16.9
-9.96%
jan 1, 1994
125.2
-27.5
-18.01%
jan 1, 1995
138.4
+13.2
10.54%
jan 1, 1996
128.7
-9.7
-7.01%
jan 1, 1997
80.1
-48.6
-37.76%
jan 1, 1998
123.5
+43.4
54.18%
jan 1, 1999
108.4
-15.1
-12.23%
jan 1, 2000
102.6
-5.8
-5.35%
jan 1, 2001
85.204
-17.396
-16.96%
jan 1, 2002
74.837
-10.367
-12.17%
jan 1, 2003
80.767
+5.93
7.92%
jan 1, 2004
75.056
-5.711
-7.07%
jan 1, 2005
84.899
+9.843
13.11%
jan 1, 2006
86.61
+1.711
2.02%
jan 1, 2007
73.556
-13.054
-15.07%
jan 1, 2008
81.743
+8.187
11.13%
jan 1, 2009
66.621
-15.122
-18.5%
jan 1, 2010
93.983
+27.362
41.07%
jan 1, 2011
48.272
-45.711
-48.64%
jan 1, 2012
47.699
-0.573
-1.19%
jan 1, 2013
50.619
+2.92
6.12%
jan 1, 2014
70.098
+19.479
38.48%
jan 1, 2015
59.58
-10.518
-15.0%
jan 1, 2016
53.902
-5.678
-9.53%
Ranking of countries by current statistics by years


Comments: