29
/
en
AIzaSyAYiBZKx7MnpbEhh9jyipgxe19OcubqV5w
April 1, 2024
34757
Heavily indebted poor countries (HIPC)
HPC
false
2
1
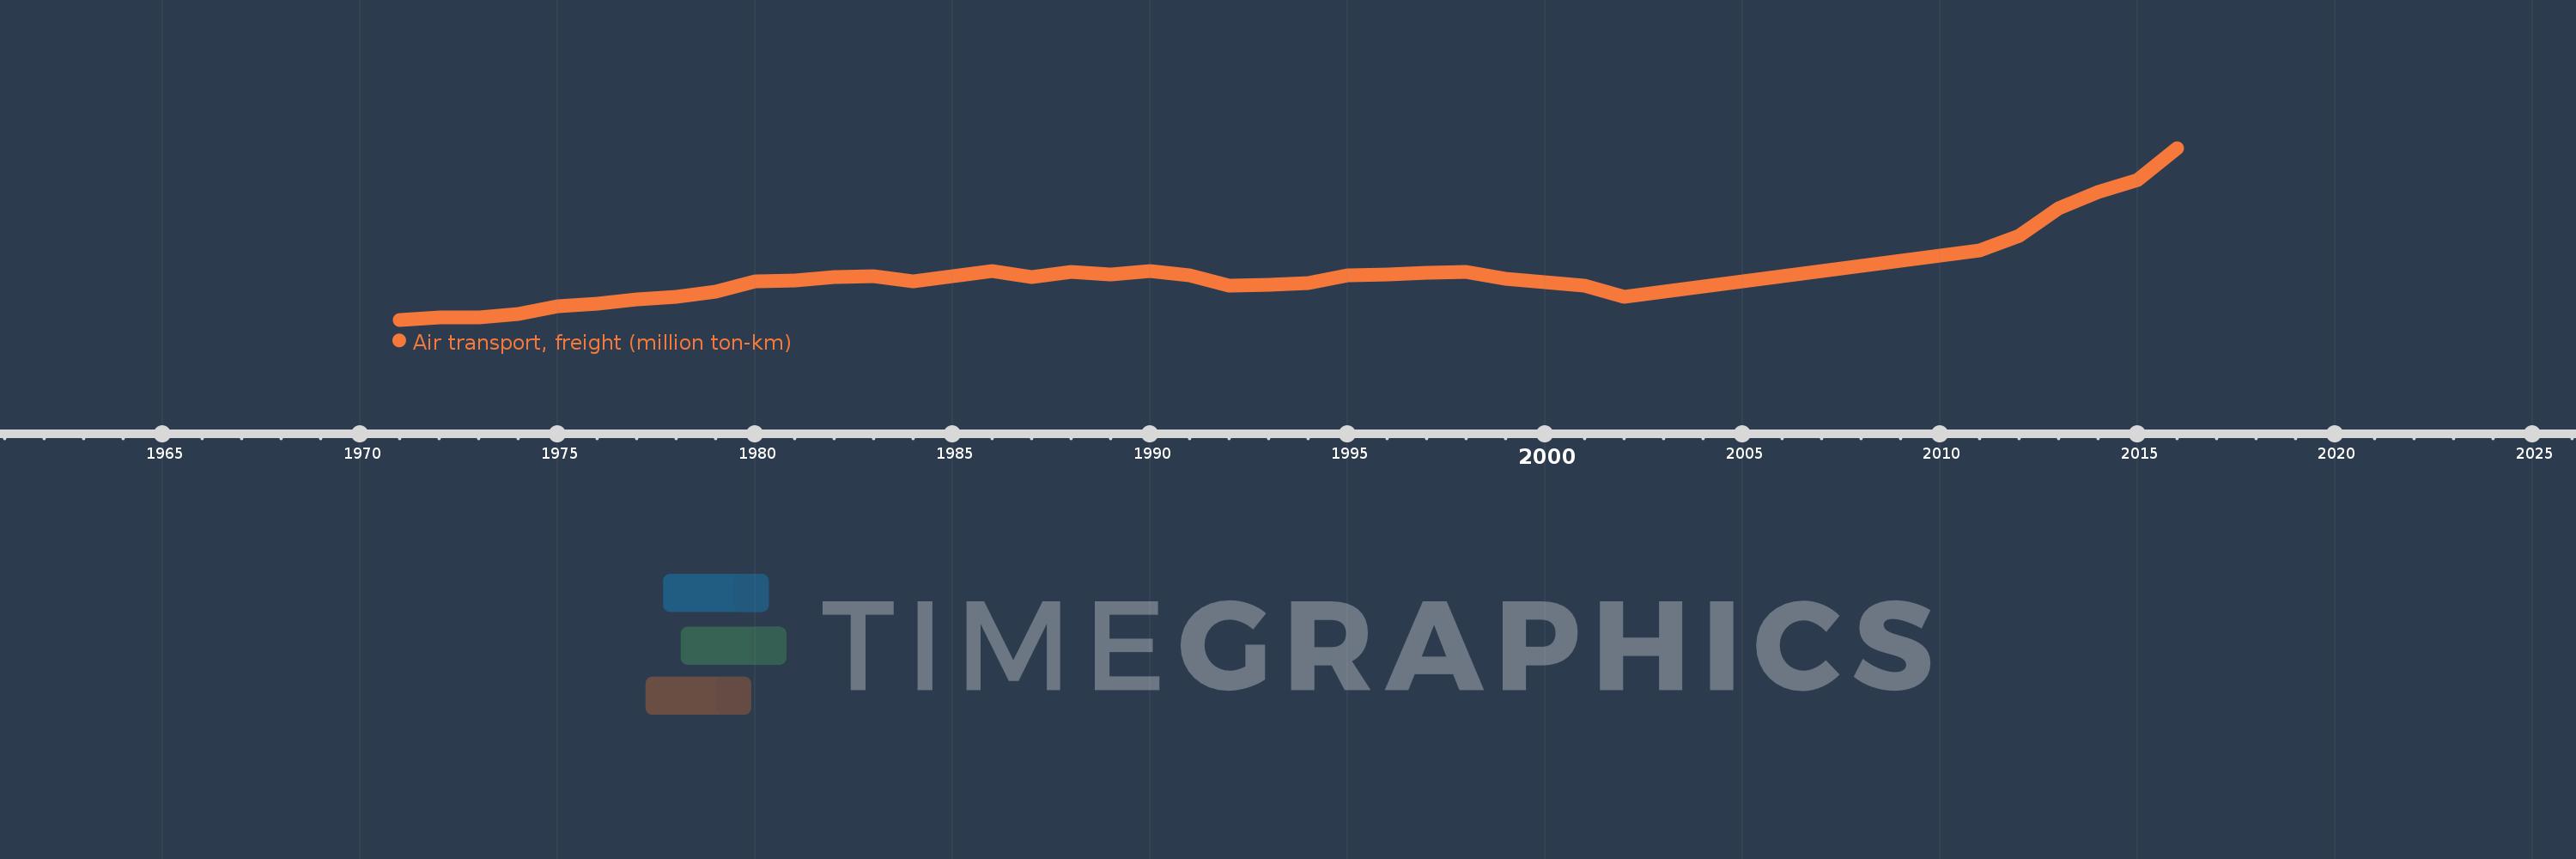
Air transport, freight (million ton-km)
2016,2015,2014,2013,2012,2011,2002,2001,2000,1999,1998,1997,1996,1995,1994,1993,1992,1991,1990,1989,1988,1987,1986,1985,1984,1983,1982,1981,1980,1979,1978,1977,1976,1975,1974,1973,1972,1971
This statistics in other country:
AfghanistanAlbaniaAlgeriaAmerican SamoaAngolaAntigua and BarbudaArab WorldArgentinaArmeniaAustraliaAustriaAzerbaijanBahamas, TheBahrainBangladeshBarbadosBelarusBelgiumBelizeBeninBhutanBoliviaBosnia and HerzegovinaBotswanaBrazilBrunei DarussalamBulgariaBurkina FasoBurundiCabo VerdeCambodiaCameroonCanadaCaribbean small statesCentral African RepublicCentral Europe and the BalticsChadChileChinaColombiaComorosCongo, Dem. Rep.Congo, Rep.Costa RicaCote d'IvoireCroatiaCubaCyprusCzech RepublicDenmarkDjiboutiDominican RepublicEarly-demographic dividendEast Asia & PacificEast Asia & Pacific (excluding high income)East Asia & Pacific (IDA & IBRD countries)EcuadorEgypt, Arab Rep.El SalvadorEquatorial GuineaEritreaEstoniaEthiopiaEuro areaEurope & Central AsiaEurope & Central Asia (excluding high income)Europe & Central Asia (IDA & IBRD countries)European UnionFijiFinlandFragile and conflict affected situationsFranceGabonGambia, TheGeorgiaGermanyGhanaGreeceGuamGuatemalaGuineaGuinea-BissauGuyanaHaitiHeavily indebted poor countries (HIPC)High incomeHondurasHong Kong SAR, ChinaHungaryIBRD onlyIcelandIDA & IBRD totalIDA blendIDA onlyIDA totalIndiaIndonesiaIran, Islamic Rep.IraqIrelandIsraelItalyJamaicaJapanJordanKazakhstanKenyaKiribatiKorea, Dem. People’s Rep.Korea, Rep.KuwaitKyrgyz RepublicLao PDRLate-demographic dividendLatin America & Caribbean Latin America & Caribbean (excluding high income)Latin America & the Caribbean (IDA & IBRD countries)LatviaLeast developed countries: UN classificationLebanonLesothoLiberiaLibyaLithuaniaLow & middle incomeLow incomeLower middle incomeLuxembourgMacao SAR, ChinaMacedonia, FYRMadagascarMalawiMalaysiaMaldivesMaliMaltaMarshall IslandsMauritaniaMauritiusMexicoMiddle East & North AfricaMiddle East & North Africa (excluding high income)Middle East & North Africa (IDA & IBRD countries)Middle incomeMoldovaMonacoMongoliaMontenegroMoroccoMozambiqueMyanmarNamibiaNauruNepalNetherlandsNew ZealandNicaraguaNigerNigeriaNorth AmericaNorwayOECD membersOmanOther small statesPacific island small statesPakistanPanamaPapua New GuineaParaguayPeruPhilippinesPolandPortugalPost-demographic dividendPre-demographic dividendQatarRomaniaRussian FederationRwandaSamoaSao Tome and PrincipeSaudi ArabiaSenegalSerbiaSeychellesSierra LeoneSingaporeSlovak RepublicSloveniaSmall statesSolomon IslandsSomaliaSouth AfricaSouth AsiaSouth Asia (IDA & IBRD)SpainSri LankaSub-Saharan Africa Sub-Saharan Africa (excluding high income)Sub-Saharan Africa (IDA & IBRD countries)SudanSurinameSwazilandSwedenSwitzerlandSyrian Arab RepublicTajikistanTanzaniaThailandTogoTongaTrinidad and TobagoTunisiaTurkeyTurkmenistanUgandaUkraineUnited Arab EmiratesUnited KingdomUnited StatesUpper middle incomeUruguayUzbekistanVanuatuVenezuela, RBVietnamWorldYemen, Rep.ZambiaZimbabwe Timeline:
This timeline shows a graph from 1971 to 2016 of Heavily indebted poor countries (HIPC). No data until 1970. Number of actual observations by date: 38.
Source name:
World Development Indicators
Source organization:
International Civil Aviation Organization, Civil Aviation Statistics of the World and ICAO staff estimates.
Categories, topics:
Infrastructure
Last updated:
apr 23, 2017
Indicators value changes by year
Maximum:
1.436K
jan 1, 2016
At the date of observation
Value
Absolute change
Change from previous value
jan 1, 1971
145.7
+145.7
0.0%
jan 1, 1972
160.2
+14.5
9.95%
jan 1, 1973
164.6
+4.4
2.75%
jan 1, 1974
189.2
+24.6
14.95%
jan 1, 1975
245.2
+56.0
29.6%
jan 1, 1976
263.7
+18.5
7.54%
jan 1, 1977
296.1
+32.4
12.29%
jan 1, 1978
317.7
+21.6
7.29%
jan 1, 1979
355.8
+38.1
11.99%
jan 1, 1980
435.5
+79.7
22.4%
jan 1, 1981
441.0
+5.5
1.26%
jan 1, 1982
466.6
+25.6
5.8%
jan 1, 1983
472.8
+6.2
1.33%
jan 1, 1984
435.7
-37.1
-7.85%
jan 1, 1985
473.6
+37.9
8.7%
jan 1, 1986
508.7
+35.1
7.41%
jan 1, 1987
463.8
-44.9
-8.83%
jan 1, 1988
507.7
+43.9
9.47%
jan 1, 1989
488.2
-19.5
-3.84%
jan 1, 1990
513.0
+24.8
5.08%
jan 1, 1991
480.4
-32.6
-6.35%
jan 1, 1992
401.7
-78.7
-16.38%
jan 1, 1993
408.7
+7.0
1.74%
jan 1, 1994
422.1
+13.4
3.28%
jan 1, 1995
481.3
+59.2
14.03%
jan 1, 1996
488.3
+7.0
1.45%
jan 1, 1997
496.2
+7.9
1.62%
jan 1, 1998
504.3
+8.1
1.63%
jan 1, 1999
454.0
-50.3
-9.97%
jan 1, 2000
427.9
-26.1
-5.75%
jan 1, 2001
402.358
-25.542
-5.97%
jan 1, 2002
318.929
-83.429
-20.74%
jan 1, 2011
664.206
+345.277
108.26%
jan 1, 2012
772.914
+108.708
16.37%
jan 1, 2013
981.171
+208.257
26.94%
jan 1, 2014
1.105K
+124.171
12.66%
jan 1, 2015
1.198K
+92.59
8.38%
jan 1, 2016
1.436K
+238.191
19.88%
Ranking of countries by current statistics by years


Comments: