29
/
en
AIzaSyAYiBZKx7MnpbEhh9jyipgxe19OcubqV5w
April 1, 2024
43057
Latin America & Caribbean (excluding high income)
LAC
false
2
1
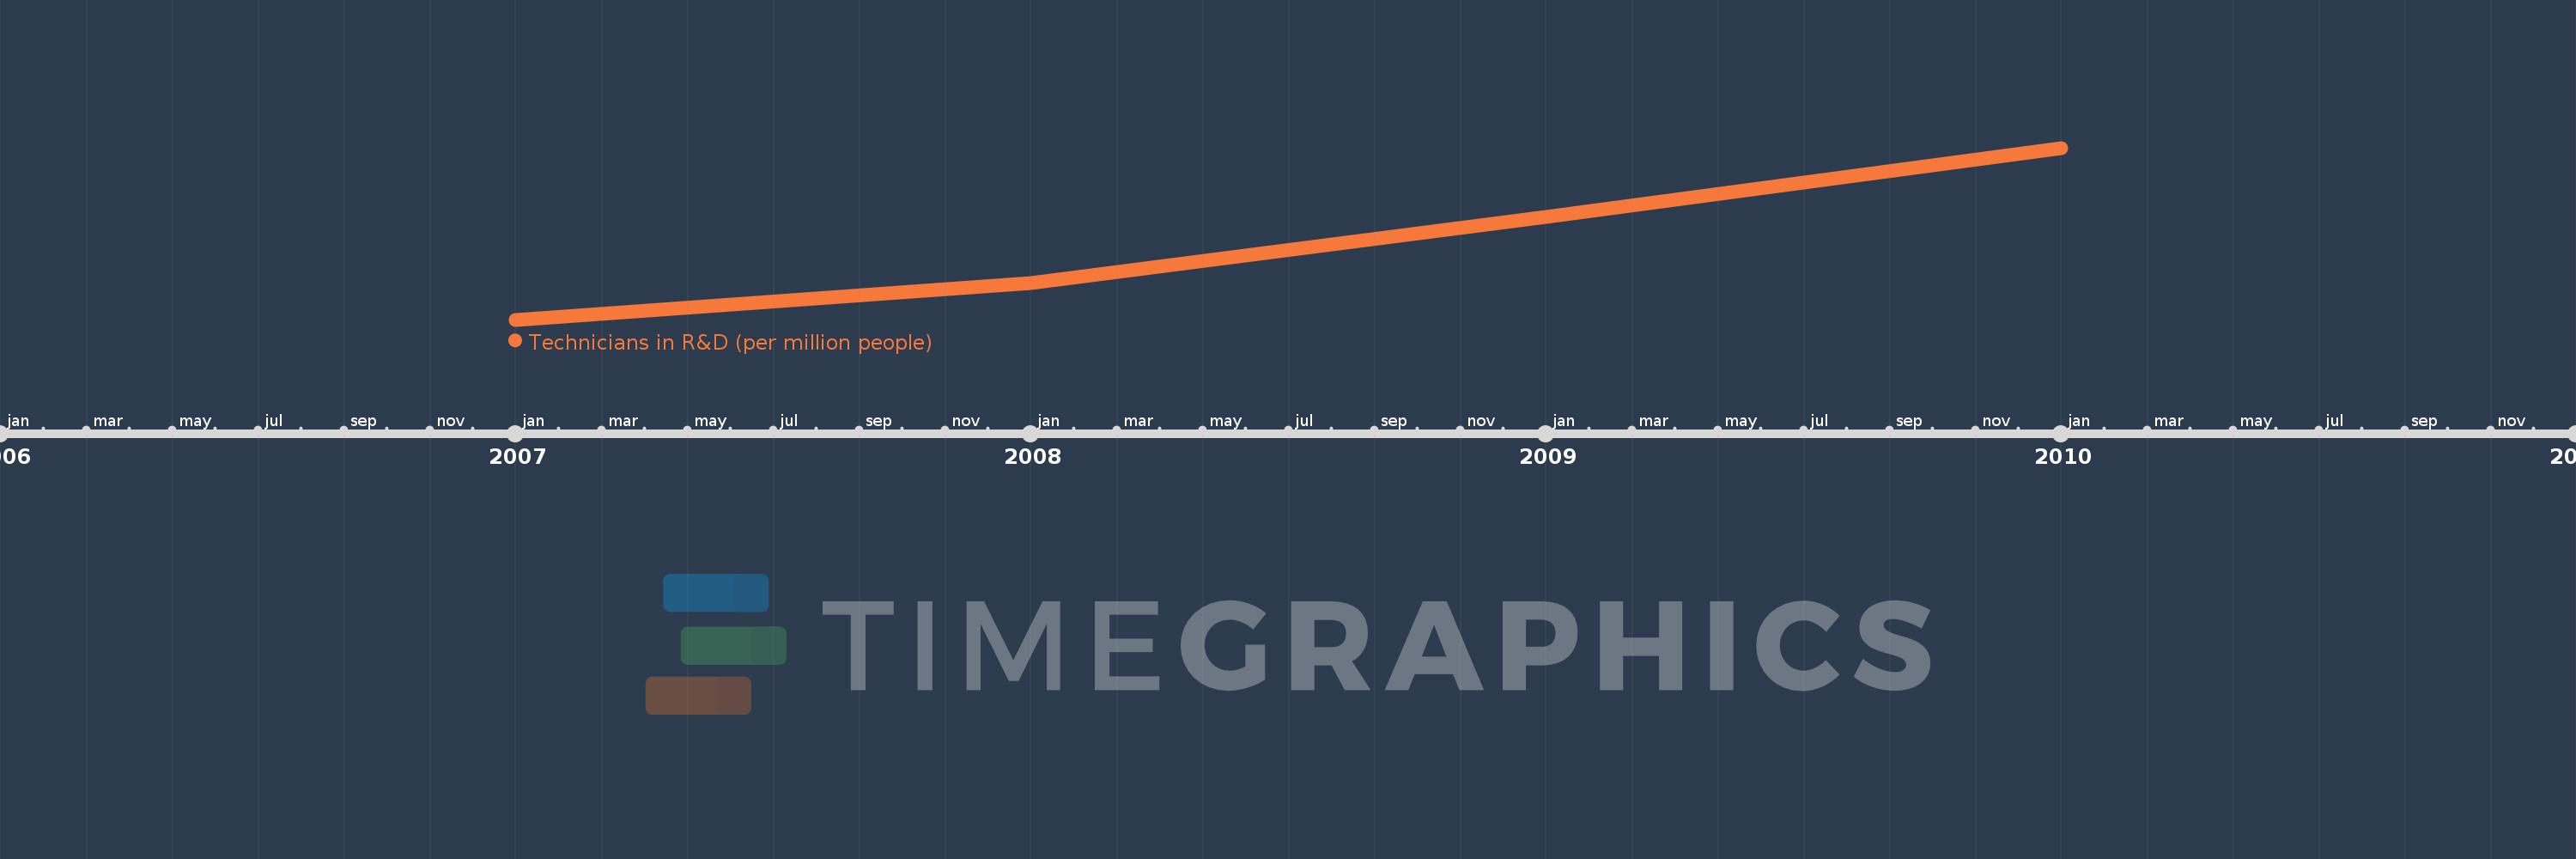
Technicians in R&D (per million people)
2010,2009,2008,2007
This statistics in other country:
Timeline:
This timeline shows a graph from 2007 to 2010 of Latin America & Caribbean (excluding high income). No data until 2006. Number of actual observations by date: 4.
Source name:
World Development Indicators
Source organization:
United Nations Educational, Scientific, and Cultural Organization (UNESCO) Institute for Statistics.
Categories, topics:
Science & Technology
Last updated:
apr 23, 2017
Indicators value changes by year
Minimum:
321.583
jan 1, 2007
Maximum:
391.276
jan 1, 2010
At the date of observation
Value
Absolute change
Change from previous value
jan 1, 2007
321.583
+321.583
0.0%
jan 1, 2008
336.624
+15.041
4.68%
jan 1, 2009
363.387
+26.763
7.95%
jan 1, 2010
391.276
+27.889
7.67%
Ranking of countries by current statistics by years


Comments: