29
/
en
AIzaSyAYiBZKx7MnpbEhh9jyipgxe19OcubqV5w
April 1, 2024
129940
Estonia
EST
true
2
1
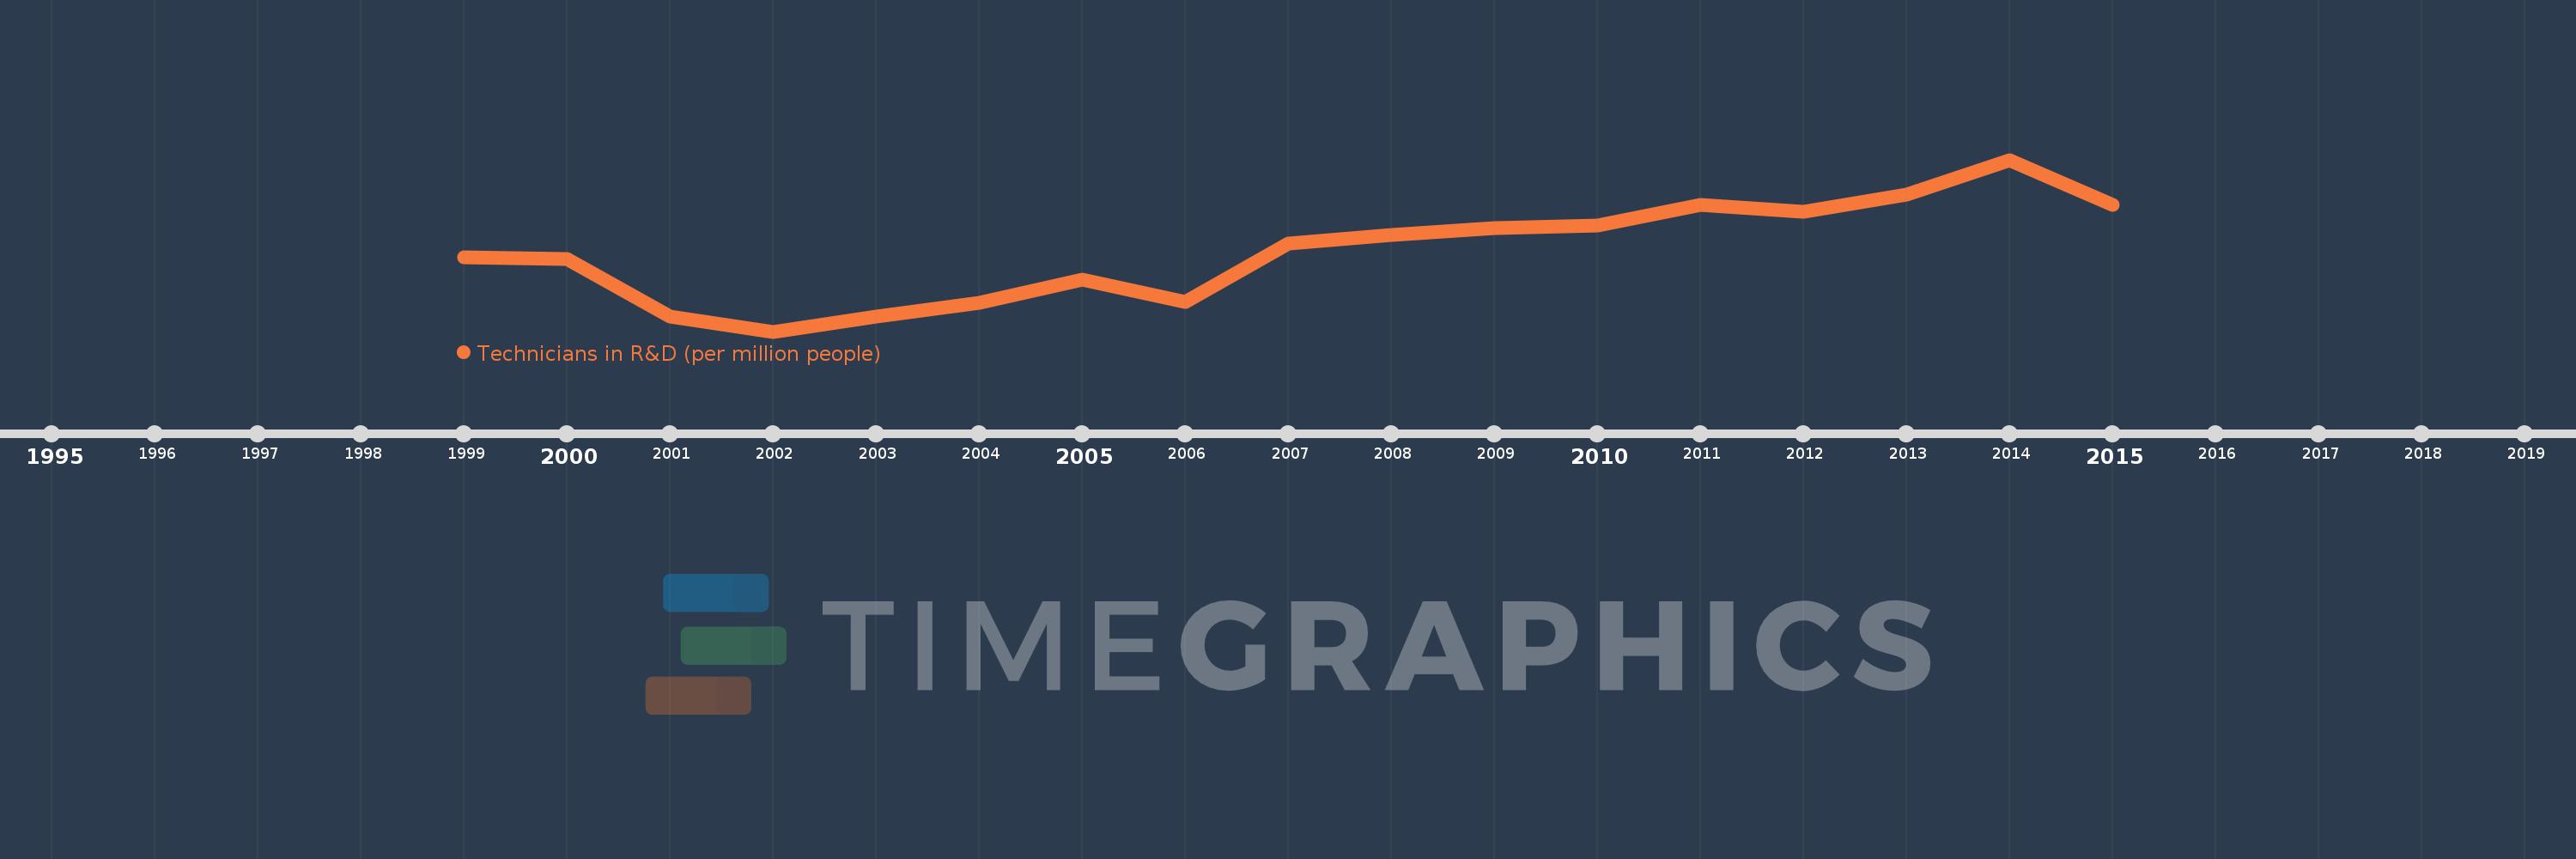
Technicians in R&D (per million people)
2015,2014,2013,2012,2011,2010,2009,2008,2007,2006,2005,2004,2003,2002,2001,2000,1999
This statistics in other country:
Timeline:
This timeline shows a graph from 1999 to 2015 of Estonia. No data until 1998. Number of actual observations by date: 17.
Source name:
World Development Indicators
Source organization:
United Nations Educational, Scientific, and Cultural Organization (UNESCO) Institute for Statistics.
Categories, topics:
Science & Technology
Last updated:
apr 23, 2017
Indicators value changes by year
Minimum:
339.14
jan 1, 2002
Maximum:
801.485
jan 1, 2014
At the date of observation
Value
Absolute change
Change from previous value
jan 1, 1999
538.969
+538.969
0.0%
jan 1, 2000
534.256
-4.713
-0.87%
jan 1, 2001
378.803
-155.453
-29.1%
jan 1, 2002
339.14
-39.662
-10.47%
jan 1, 2003
378.959
+39.819
11.74%
jan 1, 2004
417.368
+38.409
10.14%
jan 1, 2005
479.631
+62.263
14.92%
jan 1, 2006
418.246
-61.385
-12.8%
jan 1, 2007
575.084
+156.838
37.5%
jan 1, 2008
598.854
+23.771
4.13%
jan 1, 2009
617.938
+19.083
3.19%
jan 1, 2010
625.742
+7.805
1.26%
jan 1, 2011
680.885
+55.143
8.81%
jan 1, 2012
661.864
-19.022
-2.79%
jan 1, 2013
708.438
+46.574
7.04%
jan 1, 2014
801.485
+93.047
13.13%
jan 1, 2015
680.746
-120.739
-15.06%
Ranking of countries by current statistics by years


Comments: