29
/
en
AIzaSyAYiBZKx7MnpbEhh9jyipgxe19OcubqV5w
April 1, 2024
249527
Sri Lanka
LKA
true
2
1
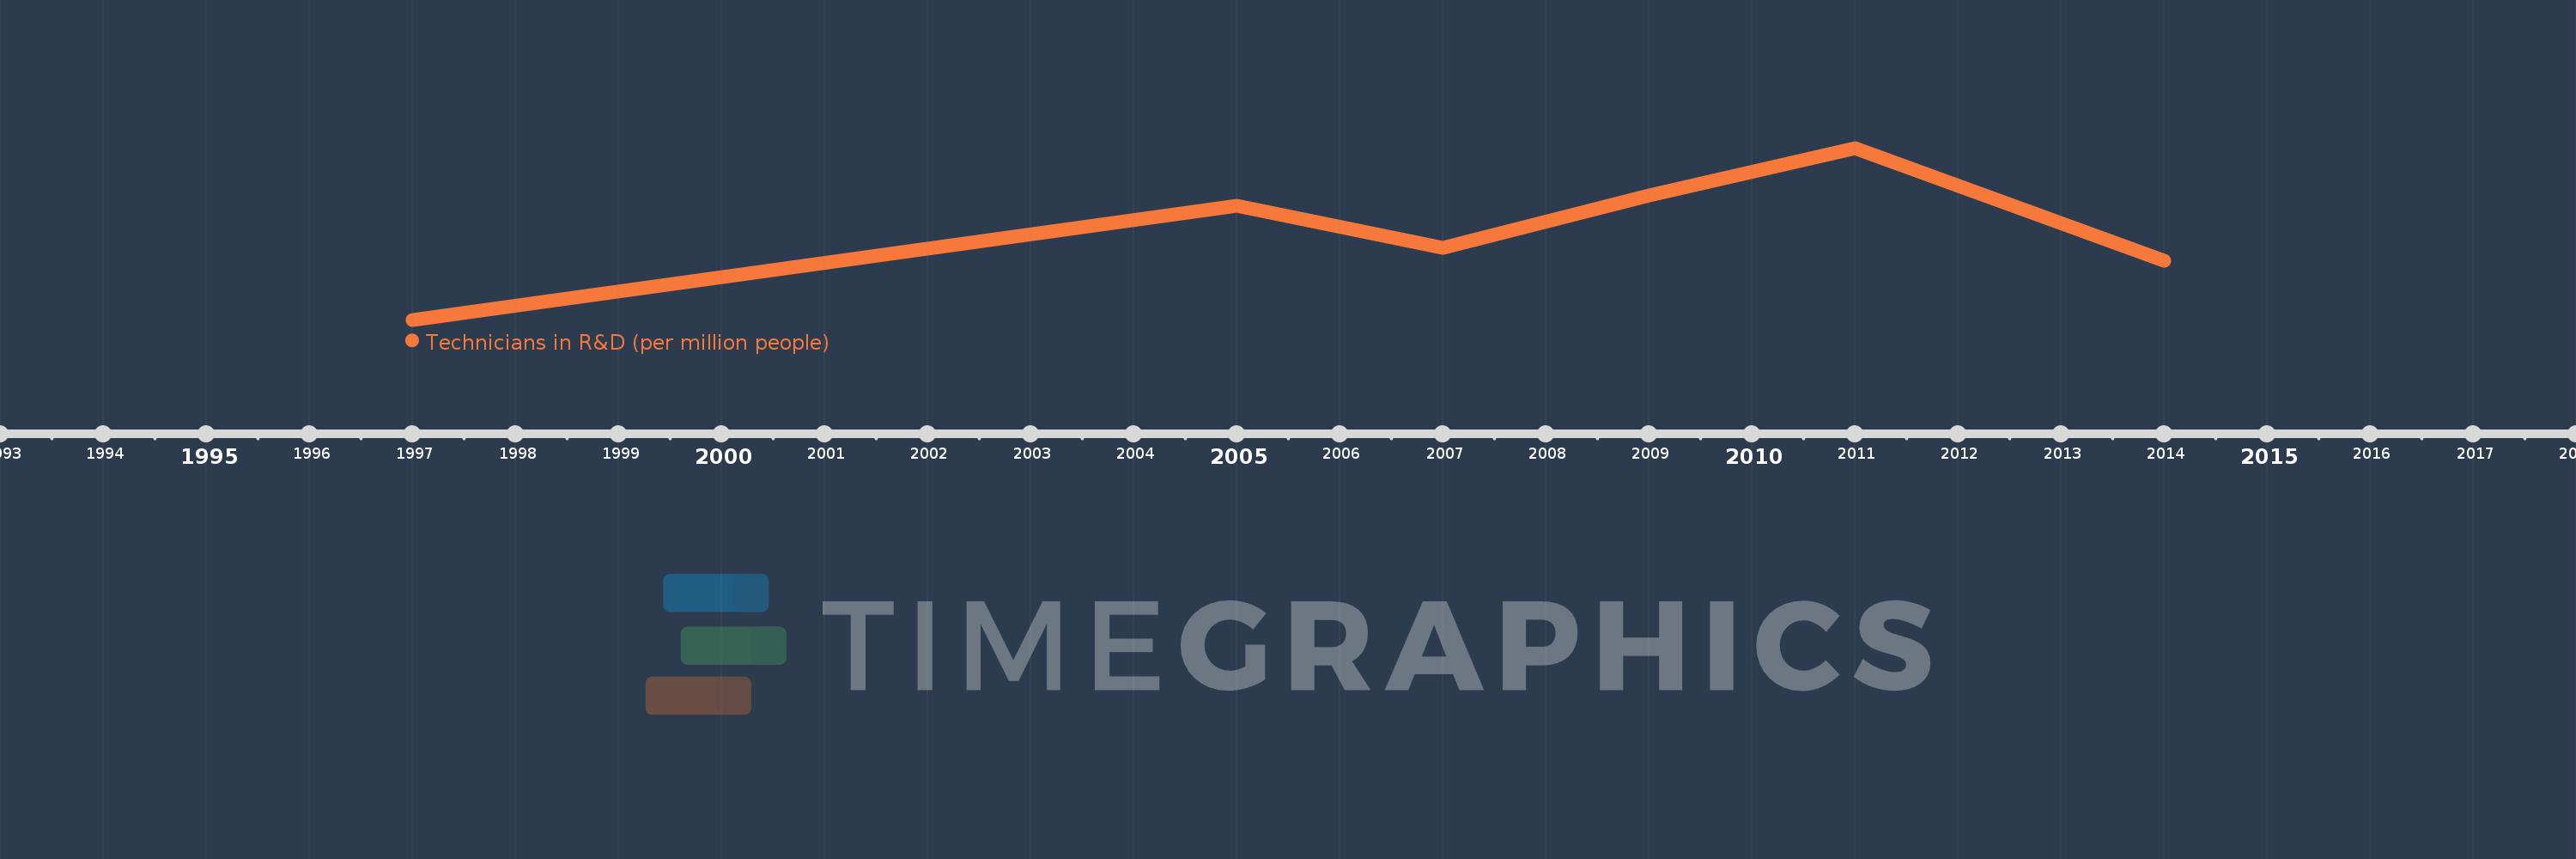
Technicians in R&D (per million people)
2014,2011,2009,2007,2005,1997
This statistics in other country:
Timeline:
This timeline shows a graph from 1997 to 2014 of Sri Lanka. No data until 1996. Number of actual observations by date: 6.
Source name:
World Development Indicators
Source organization:
United Nations Educational, Scientific, and Cultural Organization (UNESCO) Institute for Statistics.
Categories, topics:
Science & Technology
Last updated:
apr 23, 2017
Indicators value changes by year
Minimum:
45.337
jan 1, 1997
Maximum:
91.628
jan 1, 2011
At the date of observation
Value
Absolute change
Change from previous value
jan 1, 1997
45.337
+45.337
0.0%
jan 1, 2005
76.08
+30.743
67.81%
jan 1, 2007
64.659
-11.421
-15.01%
jan 1, 2009
78.749
+14.09
21.79%
jan 1, 2011
91.628
+12.879
16.35%
jan 1, 2014
61.3
-30.328
-33.1%
Ranking of countries by current statistics by years


Comments: