This statistics in other country:
Timeline:
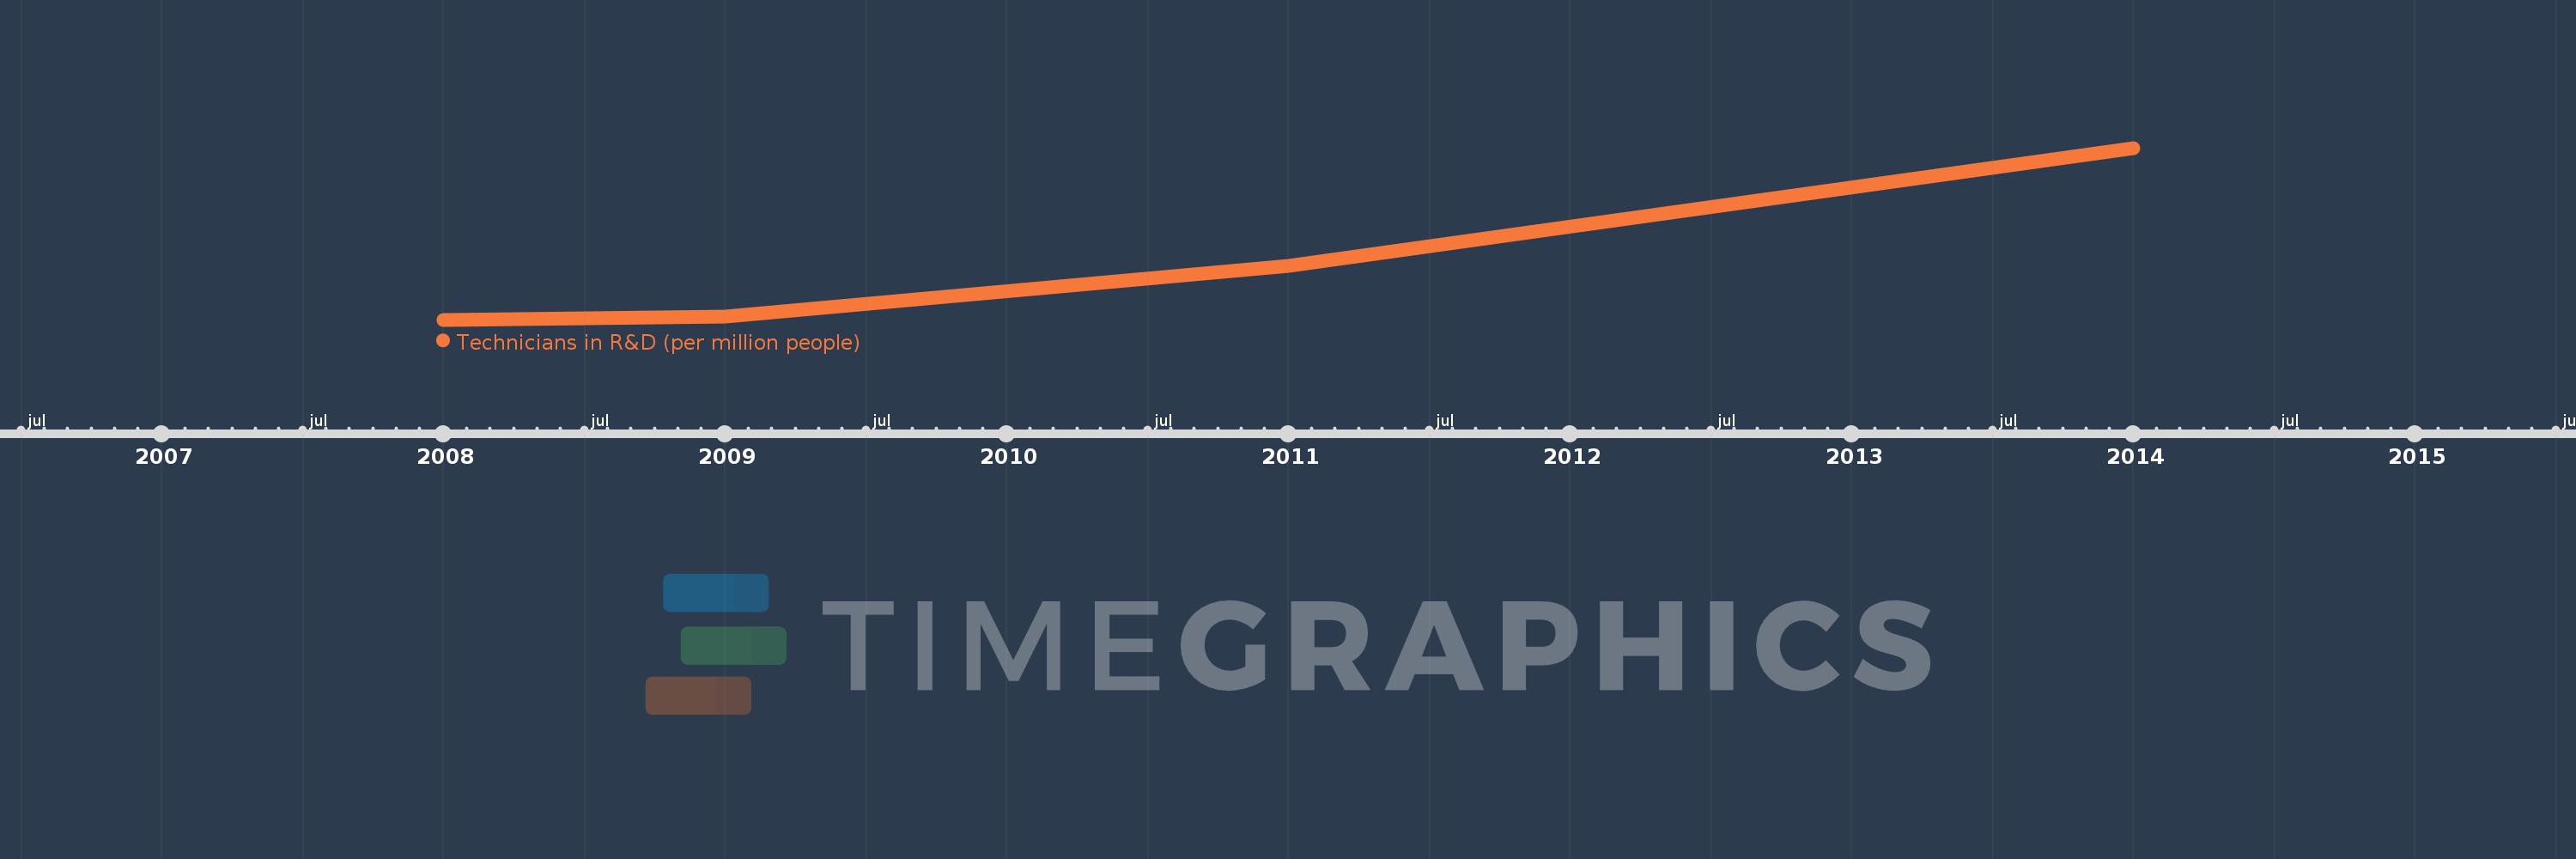
This timeline shows a graph from 2008 to 2014 of West Bank and Gaza. No data until 2007. Number of actual observations by date: 4.
Source name:
World Development Indicators
Source organization:
United Nations Educational, Scientific, and Cultural Organization (UNESCO) Institute for Statistics.
Categories, topics:
Science & Technology
Last updated:
apr 23, 2017
Indicators value changes by year
Minimum:
24.236
jan 1, 2008
Maximum:
174.681
jan 1, 2014
At the date of observation
Value
Absolute change
Change from previous value
jan 1, 2008
24.236
+24.236
0.0%
jan 1, 2009
26.721
+2.485
10.25%
jan 1, 2011
71.52
+44.799
167.66%
jan 1, 2014
174.681
+103.161
144.24%
Ranking of countries by current statistics by years


Comments: